The crypto market isn't just about terabytes of order book data, cumulative volume delta (CVD), and low-latency pings to Binance servers in Tokyo. At the end of the day, behind every market order is a human being or an algorithm written by one. And human behavior is driven by two core emotions: the fear of missing out (FOMO) and fear, uncertainty, and doubt (FUD).
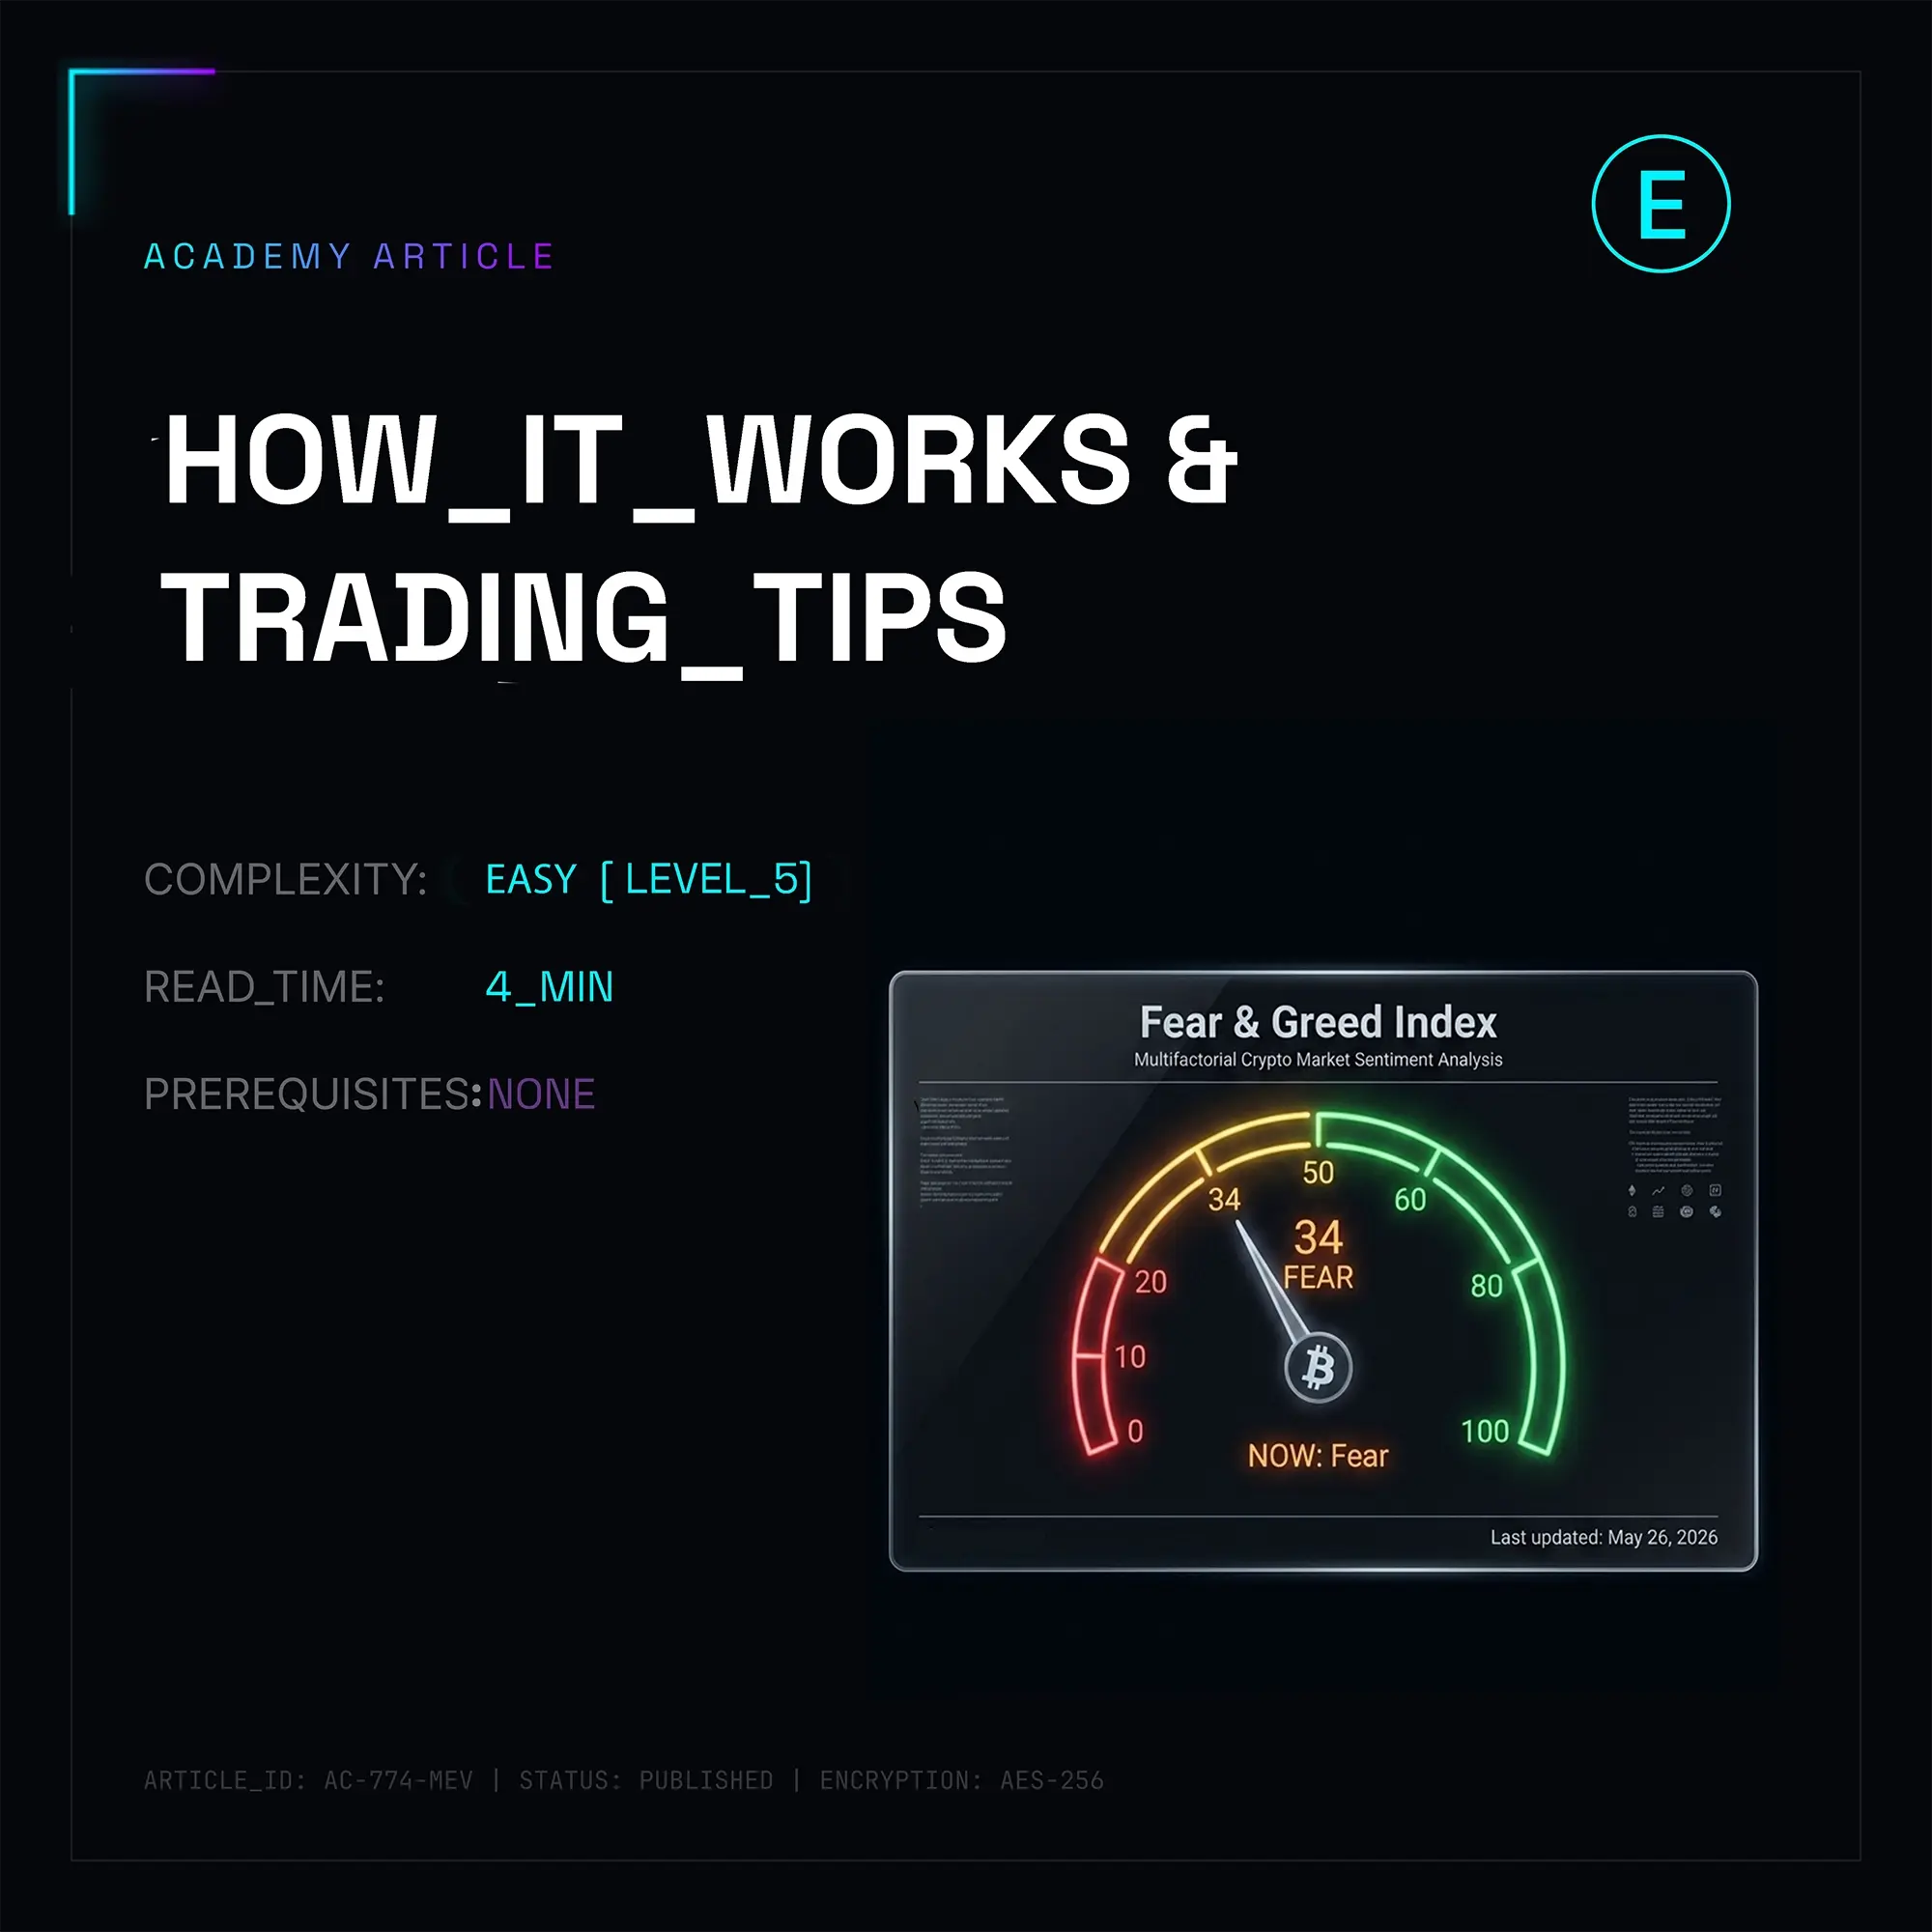
When BTC pumps hard, everyone goes into "full ape" mode, and retail completely loses its mind. When the market dumps, panic liquidations trigger massive sweeps, and assets get dumped for pennies. This exact psychological temperature of the market is what the Crypto Fear & Greed Index tries to quantify.
Let's strip away the marketing fluff and look under the hood: how this tool actually works, where it completely falls flat, and how to weaponize it in your actual trading setup to harvest retail liquidity instead of becoming it.
Index Anatomy: What's Running Under the Hood
Most retail traders treat the indicator needle (ranging from 0 to 100) like a crystal ball. In reality, it's just a mathematically weighted breakdown of five or six constantly shifting data streams.
Looking at the classic and most widely parsed index from Alternative.me, its core mechanics rely on the following breakdown:
1. Volatility (25%)
Tracks Bitcoin’s current volatility and maximum drawdowns, benchmarking them against 30-day and 90-day moving averages. An abnormal spike in volatility is almost always a dead giveaway of a panicking, unstable market (shifting the bias heavily toward Fear).
2. Market Momentum / Volume (25%)
Compares current buy and sell volumes against 30-day and 90-day MAs. When massive buy volumes hit the books daily during a bullish trend, the index flags the market as overbought, pushing it deep into the Greed zone.
3. Social Media Sentiment (15%)
Scrapes Twitter (X) by indexing crypto-related hashtags (primarily BTC-focused). The algorithm tracks post velocity and engagement metrics (likes, retweets). A sudden spike in social activity serves as a reliable marker that retail emotion is boiling over.
4. BTC Dominance (10%)
Bitcoin Dominance measures BTC's share of the total crypto market cap.
A rising BTC dominance usually signals a de-risking market, where capital flees volatile altcoins into the relative "safe haven" of Bitcoin (Fear).
Conversely, a drop in dominance indicates extreme greed, with capital rotating down the risk curve into shitcoins looking for a 100x multiplier (Greed).
5. Google Trends (10%)
Pulls search query volume data related to crypto. When phrases like "how to buy bitcoin" start charting parabolically, the market is in extreme greed—meaning the retail herd has arrived. When search volumes dry up or are dominated by terms like "bitcoin crash," the market is nearing capitulation.
6. Surveys (15% — Currently Paused)
The index creators used to run weekly sentiment polls across the crypto community. While this module is currently frozen and its weight is distributed across other metrics, the underlying architecture still reserves space for it.
Index Tiers & Classifications
| Range | Classification | Market Psychology | Systemic Trader Execution |
|---|---|---|---|
| 0 – 24 | Extreme Fear | Panic selling, capitulation, long liquidations cascading. | Scouting long entries (spot / derivatives). |
| 25 – 49 | Fear | Market uncertainty, traders cutting positions at breakeven. | Scaling in / spot accumulation. |
| 50 | Neutral | Waiting for a catalyst, balanced order flow. | Range-bound chop, trading the deviations. |
| 51 – 74 | Greed | FOMO kicking in, aggressive buying at local highs. | Taking partial profits, trailing stops tighter. |
| 75 – 100 | Extreme Greed | "BTC to a million" euphoria, overleveraged longs. | Aggressive spot distribution, hunting short setups. |
The Ultimate Index Illusion: Why "Extreme Greed" Isn't a Short Signal
The most common rookie mistake is treating the Fear & Greed Index like a low-timeframe momentum oscillator like RSI for scalping. Seeing an 85 print and blindly shorting, or buying at 15, is an express ticket to getting blown out.
The indicator has a critical vulnerability: it's a lagging metric that can stay pinned in extreme zones for weeks or months while price action completely overruns your position.
Case Study: During a powerful parabolic macro trend, the index can rocket into the 85-95 zone (Extreme Greed) within days. But the trend doesn't care. Institutional order flow keeps clearing depth, shorts get squeezed out to fuel the upside velocity, and while the index sits flat at 90, BTC tacks on another +40%. If you stepped in front of that freight train on day one of euphoria, you were wiped out.
The Fear & Greed Index is a macro sentiment filter, not a precision sniper tool for local tops and bottoms. Extreme prints simply mean the rubber band is stretched to its limit, but it won't tell you the exact block when it's going to snap back.
Behind the Sentiment Curtain: What You're Not Told
- The index is highly gameable by whales. With social media commanding 15% of the weight and Google Trends taking 10%, market makers and large entities can easily weaponize bot farms to systematically manipulate or suppress hype cycles around specific narratives. Sentiment painting (planting fake news or coordinated X narrative pushes) instantly forces the index needle to shift, baiting retail into panic trades directly into MM liquidity walls.
- It completely ignores the derivatives market. This is its single biggest blind spot. The index completely sweeps funding rates, open interest (OI), and liquidation heatmaps under the rug. Yet, the derivatives market is where real systemic pain is engineered, triggering the massive liquidation cascades that actually shift macro structure.
Systematizing the Index: A Rules-Based Execution Framework
To extract actual edge from this data, we need to cross-reference macro sentiment with technical structure and volume dynamics.
The Rothschild Playbook in Crypto
"Buy when there's blood in the streets, even if it's your own." Translating this to the index metrics:
- Long-term macro spot accumulation is only triggered when the index prints below 20 and glues itself there for at least 5 to 7 consecutive days. This is the zone where weak hands have completely capitulated and ask depth is entirely depleted.
- Distribution and profit-taking phases are initiated exclusively when the index prints north of 80.
The Macro Bias Filter
Never trade raw index inputs on intraday timeframes. Use it strictly as a directional macro filter (Bias) to stay on the right side of order flow.
- Index > 75: Focus heavily on finding bearish reversal patterns on higher timeframes (1H, 4H). Absolutely ban chasing breakout longs into new local highs.
- Index < 25: Scout for high-invalidations long setups (failed breakdowns, liquidity sweeps, deviations, or bullish cumulative volume delta divergence).
Automating Sentiment Streams: Building a Custom Python Tracker
Why waste time manually scraping websites and dodging ad banners when you can pull raw JSON data directly via API, clean it, and feed it straight into your execution scripts or Telegram alert channels?
Below is a clean, production-ready Python script that fetches historical sentiment data, parses the current print, and calculates a Simple Moving Average (SMA) to filter out transient market noise.
import requests
import pandas as pd
from datetime import datetime
def get_fear_and_greed_data(limit: int = 100) -> pd.DataFrame:
    """
    Fetch historical Fear and Greed data via public API.
    Returns a cleaned Pandas DataFrame for analysis.
    """
    url = f"https://api.alternative.me/fng/?limit={limit}&format=json"

    try:
        response = requests.get(url, timeout=10)
        response.raise_for_status()
        data = response.json()['data']
    except Exception as e:
        print(f"API request failed: {e}")
        return pd.DataFrame()
    # Parse JSON payload
    df = pd.DataFrame(data)

    # Cast types: indices and timestamps must be numerical
    df['value'] = df['value'].astype(int)
    df['timestamp'] = df['timestamp'].astype(int)

    # Format UNIX timestamps to ISO strings
    df['date'] = df['timestamp'].apply(lambda x: datetime.utcfromtimestamp(x).strftime('%Y-%m-%d'))

    # Filter columns and reorder chronologically (oldest to newest)
    df = df[['date', 'value', 'value_classification']]
    df = df.iloc[::-1].reset_index(drop=True)

    return df
def analyze_sentiment(df: pd.DataFrame, sma_period: int = 7) -> pd.DataFrame:
    """
    Calculate simple moving average to filter noise and generate macro biases.
    """
    if df.empty or len(df) < sma_period:
        return df

    # Standard SMA calculation on raw index prints
    df['sma'] = df['value'].rolling(window=sma_period).mean().round(2)

    # Counter-trend macro bias assignment
    df['action_signal'] = 'HOLD'
    df.loc[df['value'] <= 20, 'action_signal'] = 'ACCUMULATE (BUY)'
    df.loc[df['value'] >= 80, 'action_signal'] = 'DISTRIBUTE (SELL)'

    return df
if __name__ == "__main__":
    # Query 30-day lookback window
    days_to_fetch = 30
    raw_df = get_fear_and_greed_data(limit=days_to_fetch)

    if not raw_df.empty:
        processed_df = analyze_sentiment(raw_df, sma_period=7)

        # Print 5-day tail for current evaluation
        print(f"\n=== Market Sentiment Analysis (Last 5 Days) ===")
        print(processed_df.tail(5).to_string(index=False))

        # Extract latest metrics
        current_val = processed_df.iloc[-1]['value']
        current_status = processed_df.iloc[-1]['value_classification']
        current_signal = processed_df.iloc[-1]['action_signal']

        print(f"\nCurrent Status: {current_val} [{current_status}]")
        print(f"Script Signal: {current_signal}")
    else:
        print("Data processing failed.")
You can drop this script into a server cron job to pull data once a day. When the action_signal rotates to ACCUMULATE or DISTRIBUTE, fire a webhook alert to your terminal and start hunting for structural validation on your charts.
Cross-Market Sentiment Analysis: Alternative Indicators Retail Ignores
Building a trading system solely around the Crypto Fear & Greed Index is like looking at the market through a single rearview mirror. True systematic trading requires validating sentiment against harder metrics—data points that whales and market makers can't easily spoof with social media bots.
To confirm whether the market is experiencing genuine panic or actual euphoria, institutional players cross-reference the index with these on-chain and derivatives metrics:
1. Funding Rate
These are the periodic cash flows exchanged between longs and shorts on perpetual swaps (perps).
When the Fear & Greed Index spikes deep into Extreme Greed (85+), checking the funding rate is mandatory. If funding is anomalously high and positive (e.g., > 0.05% per 8-hour interval), it means long leverage is completely overextended. The market is primed for a long squeeze—a sharp liquidation flush down to clear out the imbalance—regardless of the bullish narrative flooding X.
Conversely, flat or negative funding paired with a low sentiment index marks a prime environment to spot-buy or scale into long positions.
2. Equity Market Sentiment (CNN Fear & Greed)
Crypto doesn't trade in a vacuum anymore. It remains heavily correlated with macroeconomics and legacy US indices like the S&P 500 and Nasdaq.
If the crypto index prints a value of 30 (Fear) but the CNN Equity Sentiment Index is sitting at 15 (Extreme Fear), expect the crypto drawdown to drag out. Institutional desks will actively de-risk across all asset classes due to broader macroeconomic pressure.
3. Put/Call Options Ratio
Options volume on venues like Deribit reveals exactly how hedgers and smart money are positioning their capital.
A spike in the Put/Call ratio above 1.0 indicates that major players are aggressively buying downside protection (put options). If the Crypto Fear & Greed Index is still drifting in neutral territory during this volume shift, trust the options chain over retail sentiment—smart money is already braced for a drop.
The Checklist: Can You Actually Trust the Index Right Now?
Before executing any trade based on current index values, run the market context through this execution filter:
- What is the dominant trend on higher timeframes (Daily/Weekly)? In a strong bull run, the index will constantly run hot, flashing overbought and extended greed. In a structural bear market, it will remain buried in the fear zone indefinitely.
- Where are the key liquidity pools sitting? If the index indicates Greed, but a massive cluster of short liquidations rests right above current price action, the market will likely run the stops on those shorts first (driving price higher) before printing a local top.
- Is the index value backed by volume? A sentiment push into greed on declining volume is a clear sign of buyer exhaustion, signaling an impending trend reversal.
The Operator's Verdict
The Crypto Fear & Greed Index works well as a thermometer, but it's a terrible crystal ball. It is highly effective for long-term investors and swing traders looking to map out macro cycle phases.
Use it strictly as a contrarian filter for general market bias: buy the panic, distribute into the euphoria. But never open a market order just because the index needle hit a specific color zone. Always anchor crowd psychology to the tape—charts, volume profile, and funding rates. That is how you capture market liquidity instead of becoming it.