

The absolute fastest way to catch an explosive breakout before it triggers is to track extreme volatility compression pairing with hidden volume accumulation before price even twitches.
The Problem: Why You Keep Top-Tick Buying
Every trader has lived through this nightmare. You open your terminal, spot a coin up +25% over the last two hours, instantly ape into a long position, and… literally three minutes later, the chart nosedives off a cliff. Congratulations: you just served as exit liquidity for the smart money that got in quietly.
Most market participants trade like a mindless herd—they react purely after the move has already happened. By the time price is flying, liquidation tickers are flashing, and Telegram calls are screaming "to the moon," whale market-makers are dumping their positions directly into your market buy orders. To stop funding everyone else's PnL, you need to learn to enter positions when the chart looks aggressively boring and volatility is essentially dead.
The Mechanics: What Really Happens Right Before the Spike
Markets endlessly cycle between two states: accumulation (compression) and distribution (expansion). You can't coil a spring forever—eventually, it has to snap.
When a market maker or a major fund is building a position in an altcoin, they can't afford to push price up while sizing in; doing so destroys their average entry price. Instead, they stealthily absorb all available sell-side liquidity within a tight range. While this happens, here's what shows up on the chart:
- Price Action Contracting: The spread between the daily high and low shrinks rapidly.
- Historical Volatility (HV) Crashing: The chart flattens out into an agonizing chop or a tight horizontal range.
- Order Book Drying Up: Retail limit orders get wiped out or canceled, bringing order flow to a dead standstill.
- Volume Delta Anomalies: Price stays completely flat, but subtle, aggressive market buys keep firing inside the narrow candle range, sending Relative Volume (RVOL) surging.
The moment the circulating float gets vacuumed out of the order book, a liquidity void forms. At that point, a single market order for $50k–$100k sends the coin straight to the stratosphere because there simply aren't any thick ask walls left to absorb it.
Screener Metrics Breakdown
Instead of wasting time manually flipping through 500 charts, we configure custom screeners to filter for specific mathematical anomalies:
| Metric | Coil Phase (Squeeze) | Ignition Phase (Breakout) | What It Actually Means for Your Money |
|---|---|---|---|
| BB Width (20, 2) | < 0.03 - 0.05 | > 0.15 | Volatility is squeezed to the absolute limit; Bollinger Bands are at multi-week lows (14–30 days). |
| RVOL (Relative Vol) | > 2.2 during squeeze | > 5.0 | Price is range-bound, yet volume is running 2–3x above average. Someone is quietly vacuuming the book. |
| Keltner / BB Ratio | Inside channels | Channel breach | Bollinger Bands have completely compressed inside the Keltner Channels (textbook TTM Squeeze setup). |
| Funding Rate | Near 0.00% or negative | Sharp spike (+ or -) | Retail hasn't caught on yet. There is zero leverage bias or crowd positioning. |
| Open Interest (OI) | Flat or steadily rising | Parabolic surge | OI is building up during chop—institutional smart money is positioning, not just retail gamblers. |
The 30-Second Scanner Workflow
If you're using professional screeners like TradingView, Coinglass, ScalpStation, or custom internal tools, here is your quick-scan checklist:
- Sort by BBW (Bollinger Bands Width): Set your timeframe to 15m or 1h. Filter the asset list from lowest to highest values.
- Filter by 24h Volume: Exclude dead, illiquid shitcoins with under $5M–$10M daily volume (insufficient liquidity means you'll get rekt by slippage when exiting).
- Cross-Reference RVOL / OI: Spot the confluence: BBW sitting at the bottom of the list while 15m or 1h RVOL spikes above 200–300%.
- Evaluate Structure: Pull up the chart. If you see a tight 1–1.5% range with a sudden flattening or uptick in cumulative volume delta, that coin is primed for an explosive move.
Production-Ready Python Aggregator
Here is a production-ready script to scan for these exact anomalies. Powered by `ccxt`, it queries the perpetual futures market, calculates TTM Squeeze parameters and RVOL, and prints a real-time watchlist of breakout-ready tickers straight to your console.
import asyncio
import ccxt.async_support as ccxt
import pandas as pd
import numpy as np
# Limit maximum concurrent requests
MAX_CONCURRENT_REQUESTS = 20
async def analyze_market(exchange, symbol, semaphore):
   async with semaphore:
       try:
           # Fetch 100 candles on the 15-minute timeframe
           ohlcv = await exchange.fetch_ohlcv(
               symbol,
               timeframe='15m',
               limit=100
           )
           if not ohlcv or len(ohlcv) < 50:
               return None
           df = pd.DataFrame(
               ohlcv,
               columns=['time', 'open', 'high', 'low', 'close', 'volume']
           )
           # ===== Bollinger Bands (20, 2) =====
           df['sma'] = df['close'].rolling(window=20).mean()
           df['std'] = df['close'].rolling(window=20).std()
           df['bb_upper'] = df['sma'] + (df['std'] * 2)
           df['bb_lower'] = df['sma'] - (df['std'] * 2)
           # Prevent division by zero
           df['bb_width'] = np.where(
               df['sma'] != 0,
               (df['bb_upper'] - df['bb_lower']) / df['sma'],
               np.nan
           )
           # ===== Relative Volume (RVOL) =====
           df['vol_sma'] = df['volume'].rolling(window=20).mean()
           # Prevent division by zero
           df['rvol'] = np.where(
               df['vol_sma'] != 0,
               df['volume'] / df['vol_sma'],
               np.nan
           )
           # Replace inf with NaN
           df.replace([np.inf, -np.inf], np.nan, inplace=True)
           # Ensure sufficient data length
           if len(df) < 52:
               return None
           # Last closed candle
           last_width = df['bb_width'].iloc[-2]
           last_rvol = df['rvol'].iloc[-2]
           last_close = df['close'].iloc[-2]
           # NaN check
           if pd.isna(last_width) or pd.isna(last_rvol):
               return None
           # Minimum band width over previous 50 candles
           # EXCLUDING the candle being analyzed
           historical_widths = df['bb_width'].iloc[-52:-2]
           if historical_widths.isna().all():
               return None
           min_width_50 = historical_widths.min()
           # Filter conditions
           is_squeezed = last_width <= (min_width_50 * 1.15)
           has_volume_spike = last_rvol >= 2.5
           if is_squeezed and has_volume_spike:
               return {
                   'symbol': symbol,
                   'close': float(last_close),
                   'bb_width': round(float(last_width), 4),
                   'rvol': round(float(last_rvol), 2)
               }
       except Exception as e:
           print(f"[ERROR] {symbol}: {e}")
           return None
async def main():
   exchange = ccxt.binance({
       'enableRateLimit': True,
       'options': {
           'defaultType': 'future'
       }
   })
   semaphore = asyncio.Semaphore(MAX_CONCURRENT_REQUESTS)
   try:
       await exchange.load_markets()
       # Target USDT perpetual futures only
       symbols = [
           symbol
           for symbol in exchange.symbols
           if symbol.endswith('/USDT:USDT')
       ]
       print(f"[*] Scanning {len(symbols)} futures pairs...")
       tasks = [
           analyze_market(exchange, symbol, semaphore)
           for symbol in symbols
       ]
       results = await asyncio.gather(*tasks)
       hot_targets = [
           result
           for result in results
           if result is not None
       ]
       # Sort descending by RVOL
       hot_targets.sort(
           key=lambda x: x['rvol'],
           reverse=True
       )
       print("\n=== BREAKOUT TARGETS IDENTIFIED ===")
       if not hot_targets:
           print("No matching targets found.")
           return
       print(
           f"{'Symbol':<18} | "
           f"{'Price':<15} | "
           f"{'BB Width':<10} | "
           f"{'RVOL':<8}"
       )
       print("-" * 65)
       for target in hot_targets:
           print(
               f"{target['symbol']:<18} | "
               f"{target['close']:<15.8f} | "
               f"{target['bb_width']:<10} | "
               f"{target['rvol']:<8}"
           )
   finally:
       await exchange.close()
if __name__ == '__main__':
   asyncio.run(main())
Risk Management & Entry Mechanics: How Not to Get Whipsawed
Spotting a volatility squeeze is only half the battle. The other half is surviving the fakeout when a market maker triggers a classic shakeout to grab liquidity right before the real expansion begins.
Never Market-Buy Before Confirmation: Tracking a squeeze doesn't mean blindly jumping into a trade. Set limit orders near the bottom boundary of the consolidation range (if scaling into spot) or wait for confirmation (a 5m/15m candle close OUTSIDE the Bollinger Bands accompanied by high volume).
Setting Your Stop-Loss:
- Stop guessing your stops or using arbitrary fixed percentages like 1%.
- Base your invalidation on ATR (Average True Range). Set your stop at a distance of 1.5 * ATR from your entry, tucked safely behind the opposite boundary of the consolidation structure.
Taking Profits (TP):
- TP1 (50% of position): Lock in gains on the initial thrust at a distance equal to the full height of the consolidation range (aim for a minimum 1:2 Risk/Reward). Move remaining stop to breakeven.
- TP2 (50% of position): Ride the expansion with a trailing stop anchored to the 15m EMA9/EMA21 for as long as the trend holds structure.
Handling Fakeout Squeezes: If price breaches the consolidation boundary but volume immediately vanishes while the very next candle closes right back inside the range—you're getting played. Don't double down or average down; cut the trade instantly and accept the small loss.
Remember: A genuine breakout following extreme compression moves fast and offers no second thoughts. If price breaks out and immediately stalls or chops, the momentum isn't there—flatten your position.
Next-Level Alpha Layer: Hidden Signals Missed by 95% of Traders
Most screeners just scan for basic price compression. The problem? Pure price compression usually leads to a chop-fest that hunts stops in both directions. If you want to push your win rate into the 75–80% range, you need a second layer of filtering: derivatives context.
1. Open Interest (OI) & Funding Rate Divergence
The prime "coiled spring" setup happens when price is trapped in a tight range while perp data shows massive anomalous activity:
- Short Squeeze Setup: Price is coiling inside a tight 1% band. Open Interest (OI) spikes 15–20% in a matter of hours, while Funding Rates dive deep into negative territory (e.g., -0.04%). Translation: retail traders are aggressively shorting the range, expecting a breakdown. Market makers see that massive wall of stops and liquidation levels resting above, triggering a violent short squeeze in the opposite direction.
- Long Squeeze Setup: Flip the script. OI surges, funding gets overheated (+0.05% or higher), and price stays pinned. There's zero liquidity left above, so market makers flush it down, wiping out overleveraged longs.
2. Multi-Timeframe (MTF) Compression Cascade
A breakout on the 15M chart gives you a quick 2–4% scalp. A breakout aligned with compression on both the 1H and 4H timeframes delivers a 15–50% monster move with zero pullbacks.
Look for coins where the 4H Bollinger Band Width is sitting in the bottom 5th percentile relative to the last 30 days, while the 15M chart shows an immediate relative volume surge (RVOL > 3.0). That's the exact moment the lower timeframe pulls the pin on the higher timeframe grenade.
Plug-and-Play Pine Script (TradingView v5)
If you prefer plotting your screener signals directly onto your TradingView charts, grab this script. It highlights volatility squeeze zones (where Bollinger Bands squeeze inside the Keltner Channels) and triggers alerts the second anomalous volume flows in.
//@version=5
indicator("Quant Squeeze & Volume Trigger [EXPERT v2]", overlay=true, max_labels_count=500)
// ======================================================
// Settings
// ======================================================
groupBB = "Bollinger Bands"
groupKC = "Keltner Channels"
groupVOL = "Volume"
groupTREND = "Trend Filter"
bbLength      = input.int(20, "BB Length", minval=1, group=groupBB)
bbMult        = input.float(2.0, "BB Multiplier", minval=0.1, group=groupBB)
kcLength      = input.int(20, "KC Length", minval=1, group=groupKC)
kcMult        = input.float(1.5, "KC Multiplier", minval=0.1, group=groupKC)
rvolThreshold = input.float(2.2, "RVOL Threshold (x)", minval=0.1, group=groupVOL)
emaLength     = input.int(200, "Trend EMA", minval=1, group=groupTREND)
showLongs     = input.bool(true, "Show LONGs", group=groupTREND)
showShorts    = input.bool(true, "Show SHORTs", group=groupTREND)
// ======================================================
// Bollinger Bands
// ======================================================
[bbMiddle, bbUpper, bbLower] = ta.bb(close, bbLength, bbMult)
// Division-by-zero guard
bbWidth = bbMiddle != 0 ? (bbUpper - bbLower) / bbMiddle : na
// ======================================================
// Keltner Channels
// ======================================================
kcMa    = ta.ema(close, kcLength)
// ATR is more reliable for Keltner Channels
kcAtr   = ta.atr(kcLength)
kcUpper = kcMa + (kcAtr * kcMult)
kcLower = kcMa - (kcAtr * kcMult)
// ======================================================
// Relative Volume
// ======================================================
volSma = ta.sma(volume, 20)
rvol = (not na(volSma) and volSma > 0) ? volume / volSma : na
// ======================================================
// TTM Squeeze Logic
// ======================================================
// Bollinger Bands strictly inside Keltner Channels
isSqueezed = bbUpper < kcUpper and bbLower > kcLower
// Was the squeeze active on the previous bar?
wasSqueezed = isSqueezed[1]
// Squeeze release confirmation
squeezeReleased = wasSqueezed and not isSqueezed
// ======================================================
// Trend Filter
// ======================================================
emaTrend = ta.ema(close, emaLength)
bullTrend = close > emaTrend
bearTrend = close < emaTrend
// ======================================================
// Breakout Confirmation
// ======================================================
// Volume confirmation
volumeConfirmed = not na(rvol) and rvol >= rvolThreshold
// Price confirmation
bullBreakout = close > bbUpper
bearBreakout = close < bbLower
// ======================================================
// Anti-Spam Logic
// ======================================================
// Prevent consecutive signals
var int lastLongBar = na
var int lastShortBar = na
cooldownBars = 10
canLong =
    na(lastLongBar) or
    (bar_index - lastLongBar > cooldownBars)
canShort =
    na(lastShortBar) or
    (bar_index - lastShortBar > cooldownBars)
// ======================================================
// Final Signals
// ======================================================
longSignal =
    showLongs and
    barstate.isconfirmed and
    squeezeReleased and
    volumeConfirmed and
    bullBreakout and
    bullTrend and
    canLong
shortSignal =
    showShorts and
    barstate.isconfirmed and
    squeezeReleased and
    volumeConfirmed and
    bearBreakout and
    bearTrend and
    canShort
if longSignal
   lastLongBar := bar_index
if shortSignal
   lastShortBar := bar_index
// ======================================================
// Visualization
// ======================================================
// Highlight active squeeze background
bgcolor(
    isSqueezed
    ? color.new(color.orange, 88)
    : na,
    title="Squeeze Background"
)
// Trend EMA
plot(
    emaTrend,
    title="EMA Trend",
    color=color.blue,
    linewidth=2
)
// LONG
plotshape(
    longSignal,
    title="LONG Signal",
    style=shape.triangleup,
    location=location.belowbar,
    color=color.lime,
    size=size.small,
    text="LONG"
)
// SHORT
plotshape(
    shortSignal,
    title="SHORT Signal",
    style=shape.triangledown,
    location=location.abovebar,
    color=color.red,
    size=size.small,
    text="SHORT"
)
// ======================================================
// Alerts
// ======================================================
alertcondition(
    longSignal,
    title="LONG Breakout",
    message="LONG breakout detected on {{ticker}}"
)
alertcondition(
    shortSignal,
    title="SHORT Breakout",
    message="SHORT breakout detected on {{ticker}}"
)
Trap Anatomy: Real Breakouts vs. Fakeouts (Shakeouts)
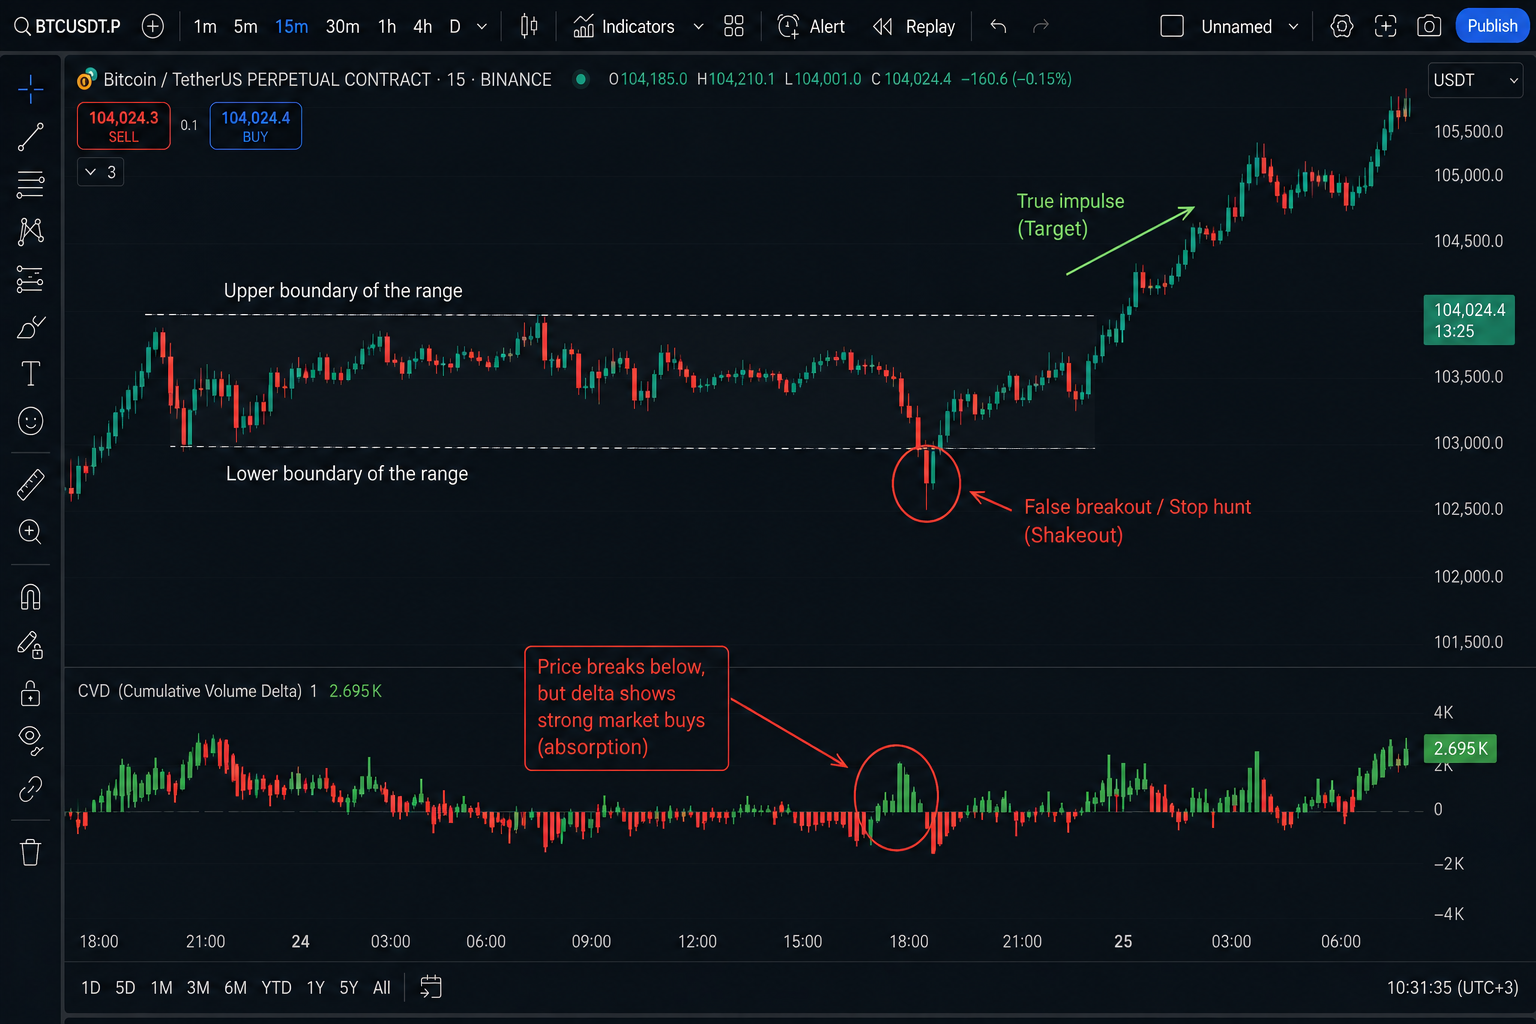
Institutional players know exactly where squeeze traders cluster their stops. That's why nearly 40% of real expansions start with a liquidity sweep first (Spring/Upthrust).
How to avoid getting trapped:
Keep an eye on Delta during the wick bar. If price pierces the bottom of the range, leaves a long lower wick, and Cumulative Volume Delta (CVD) shows aggressive market buys (a red price candle with green delta), you're looking at passive absorption. A large limit buyer just absorbed every single market stop thrown at them.
The 3-Candle Rule: A genuine breakout doesn't rotate back into the squeeze zone. If price punches out and immediately falls back into the consolidation within the next 1–2 candles, bail out instantly. That wasn't a breakout—it was a liquidity grab.
Pre-Trade Checklist (5 Seconds Before You Click)
Before pulling the trigger on a volatility screener alert, run the ticker through this quick filter:
| Step | Metric | Ideal Criteria | Red Flag (Invalidate) |
|---|---|---|---|
| 1 | 24h Volume | > $10,000,000 | < $2,000,000 (Slippage will eat your PnL) |
| 2 | BTC Correlation | BTC is ranging or moving with the alt | BTC is dumping/pumping >1.5% right now |
| 3 | Order Book (Spot/Perps) | Clear path ahead, no big limit walls | Massive limit wall within 0.5% of current price |
| 4 | Bid/Ask Spread | < 0.05% | > 0.2% (Illiquid book) |
| 5 | Key Level Proximity | Room to run for at least 1:3 R:R | Price is slamming directly into weekly resistance |
Bottom Line
Volatility screeners aren't crystal balls that predict the future. They're time-saving tools designed to help you filter out 98% of the market noise in 30 seconds flat so you can focus strictly on the 2% of assets where institutional positioning is actually going down.
Don't try to guess the breakout direction inside a squeeze without volume and delta confirmation. Let the market show its hand first, hop on the confirmed expansion, and lock in your 3–8% move with tight risk.