Trading is often compared to trying to read the crowd's mind while looking through a rearview mirror. Most indicators RSI, MACD, or moving averages—are lagging, based purely on price and time. But price without volume is just a hollow number, lacking any real skin in the game.
Volume Profile is the tool that shifts the focus from "when did it happen" to "at what price did it actually matter." While standard vertical volume shows activity in a specific time slice (like a 5-minute candle), Volume Profile reveals exactly where market participants showed maximum interest and deployed the most capital.
1. Profile Anatomy: Key Terms
To trade like a pro, you need to understand the "skeleton" of the profile. It’s essentially a horizontal histogram plotted along the price scale.
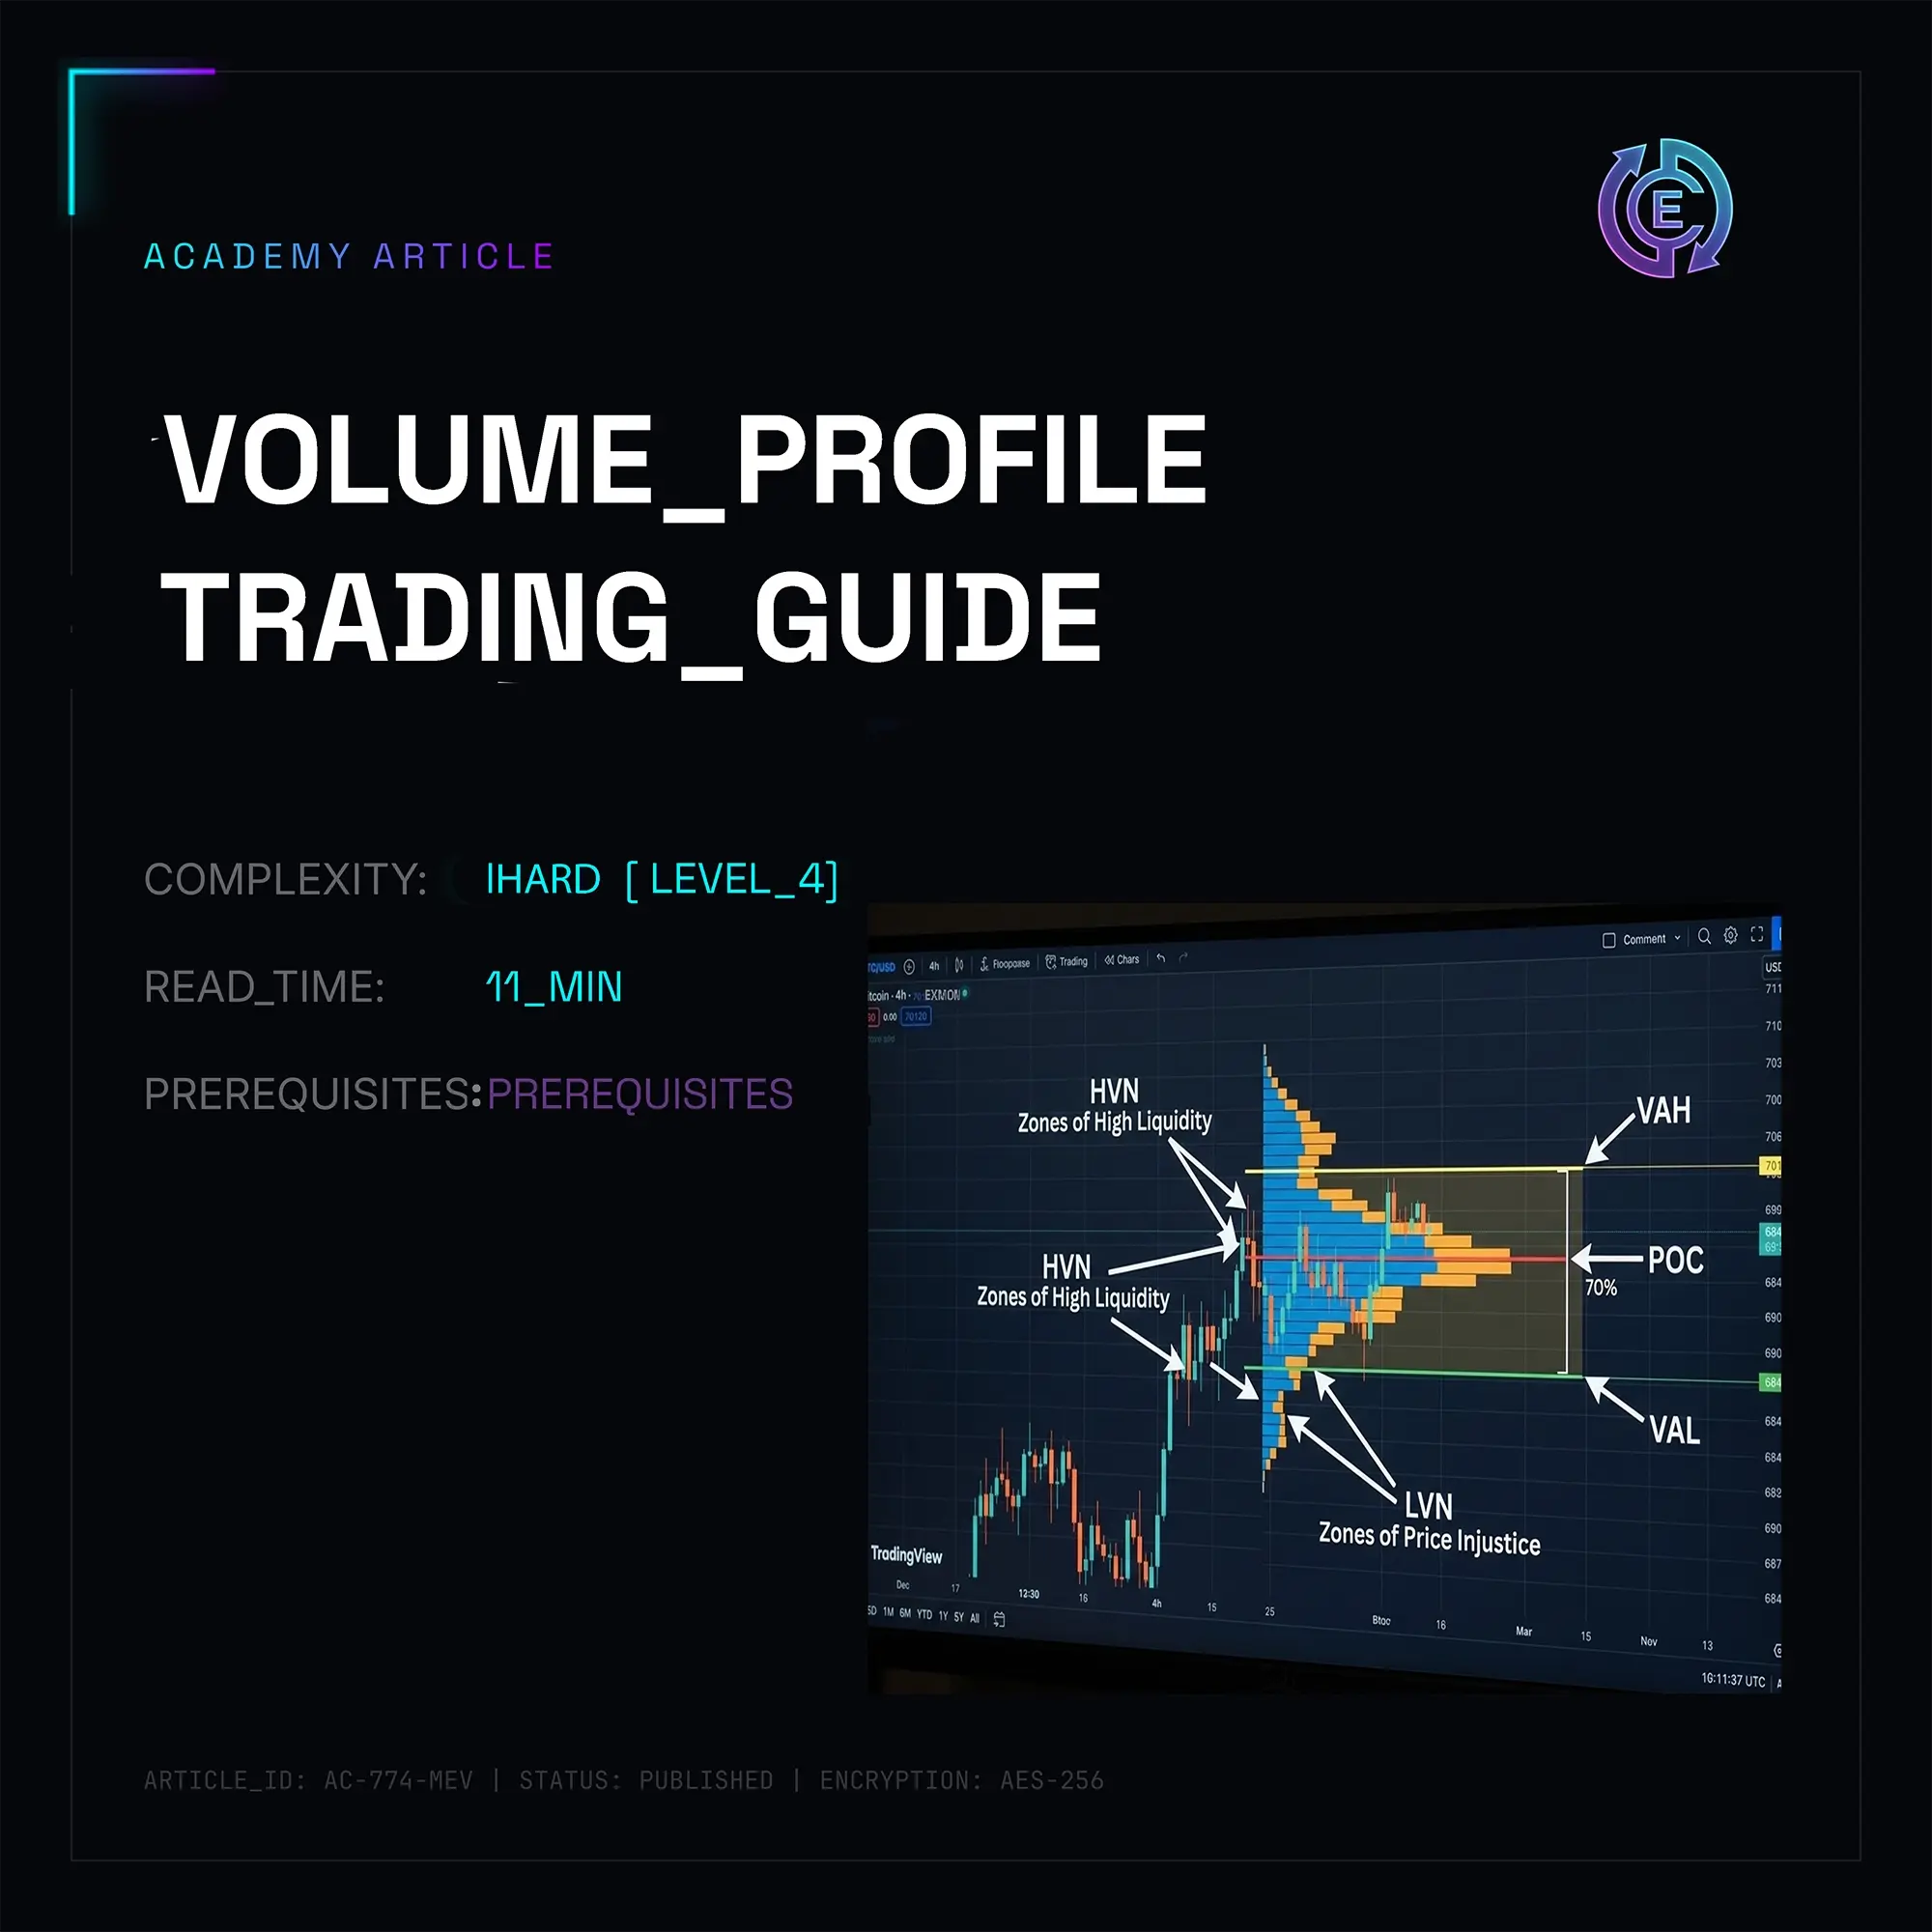
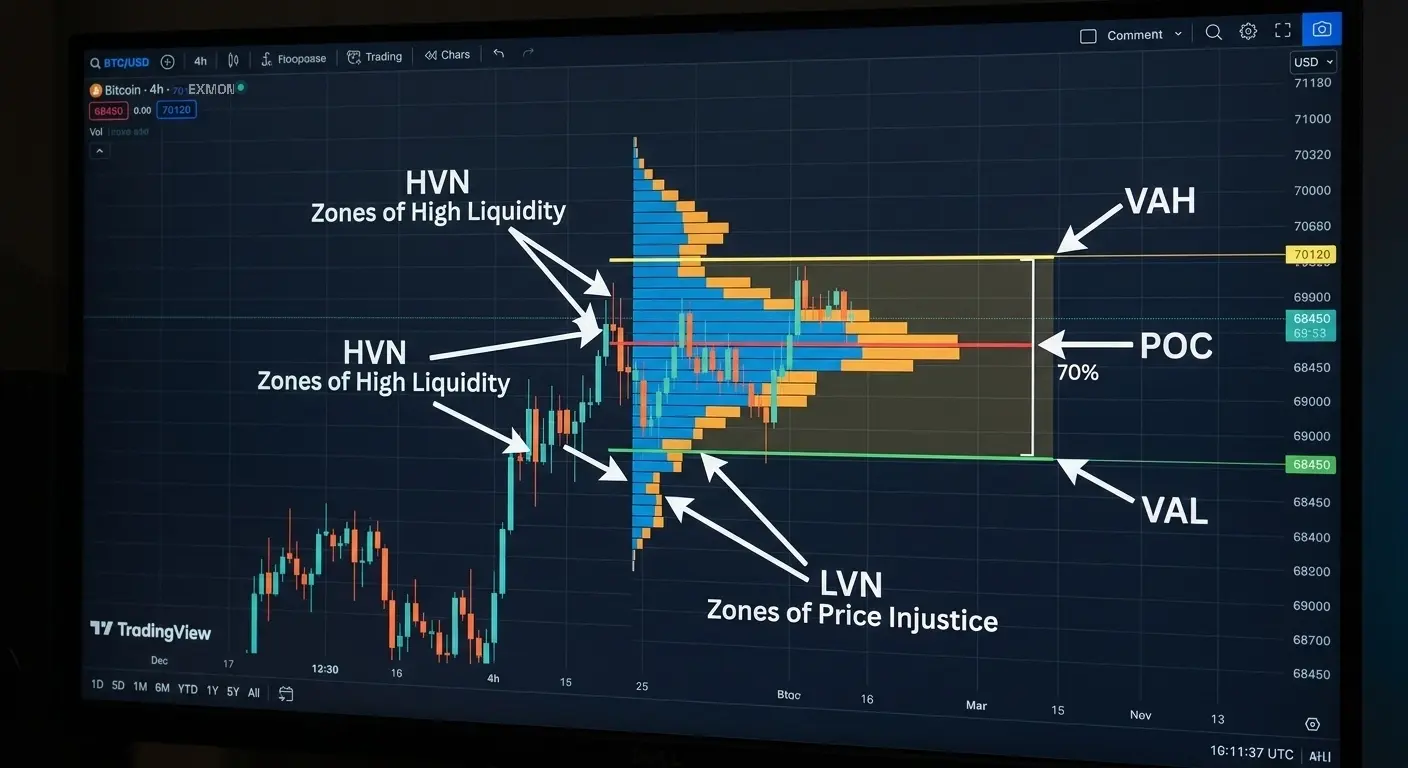
- POC (Point of Control): The longest bar in the profile. This is the price level where the highest number of contracts or lots were traded during the period. It’s the "fair value" around which the market rotates.
- VA (Value Area): The zone where 70% of the total volume for the period is concentrated. This is where the "Smart Money" (market makers, funds) prefers to build or dump their positions.
- VAH (Value Area High): The upper boundary of the Value Area.
- VAL (Value Area Low): The lower boundary of the Value Area.
- HVN (High Volume Node): The "peaks" on the histogram. These are levels of high liquidity where price often slows down or enters a chop/sideways phase.
- LVN (Low Volume Node): The "valleys." These are levels that price usually rips through instantly because there’s no institutional interest there.
2. Why is the POC both a "Magnet" and a "Wall"?
The POC represents balance. Think of an auction: if the price is too high, buyers disappear; if it’s too low, sellers walk away. The POC is the sweet spot where everyone agrees.
How to play this in practice:
- The Magnet: If price overextends far from the POC and momentum starts to fade, the market has a high probability of mean-reverting to the POC for "rebalancing."
- The Mirror Level: If yesterday’s POC (n-1) is broken from top to bottom, that level often flips into a massive overhead resistance on the retest.
3. Profile Types and Execution Strategies
Pro traders use three main profile types depending on the context:
| Profile Type | When to use | Main Goal |
|---|---|---|
| Fixed Range | Analyzing a specific impulse move or a range. | Find support/resistance levels within a complex move. |
| Visible Range | Analyzing everything currently on your screen. | Get global context and identify long-term HVNs. |
| Session Volume | Treating each trading day as a standalone profile. | Intraday trading and hunting for previous day POCs. |
The "Value Area Breakout" Strategy
If price has been ranging inside the VA for a while and then explosively breaks out past the VAH or VAL (backed by high vertical volume), it’s a signal that a new trend is loading.
- Entry: On the retest of the VA boundary.
- Stop-Loss: Placed just behind the POC of the current consolidation.
- Take-Profit: The nearest HVN (High Volume Node) on a higher timeframe.
4. Pro Tips: Watching the "Thin Areas" (LVN)
Most rookies only look for entries at the POC, but the pros keep an eye on the LVNs (Low Volume Nodes).
These are zones of "price unfairness." If price approaches a zone where very little volume was traded in the past (a gap in the histogram), it means the market considers that price "wrong."
Pro Tip: When price hits an LVN, expect either a sharp rejection or a fast "slippage" right through it. LVNs often act as the true line in the sand between bullish and bearish control.
5. Practical Example: Pine Script Automation (TradingView)
If you want to use the POC in a backtest or a bot rather than just eyeballing it, you can script it. Here is a simplified logic for finding a POC over a custom lookback:
//@version=5
indicator("Custom POC Hunter", overlay=true)
// Conceptual logic for finding the max volume level
lookback = input.int(200, "Analysis Period")
var float poc_price = na
var float max_vol = 0.0
// Scanning bars to find clusters (simplified)
// In a real strategy, use built-in volume_profile functions
// But for logic: we find the price where volume aggregated the most
if barstate.islast
    for i = 0 to lookback
        if volume[i] > max_vol
            max_vol := volume[i]
            poc_price := close[i]
plot(poc_price, color=color.red, linewidth=2, style=plot.style_linebr, title="Approx POC")
Note: In modern platforms like TradingView or ATAS, Volume Profile is a built-in standard. Writing it from scratch is mostly for building automated bots.
6. Golden Rules of Volume Profile
- Don’t trade the POC in isolation. Just because price hit the POC doesn't mean "buy." It means "pay attention." Look for confluence: a candle pattern, Delta (market buy vs. sell pressure), or footprint clusters.
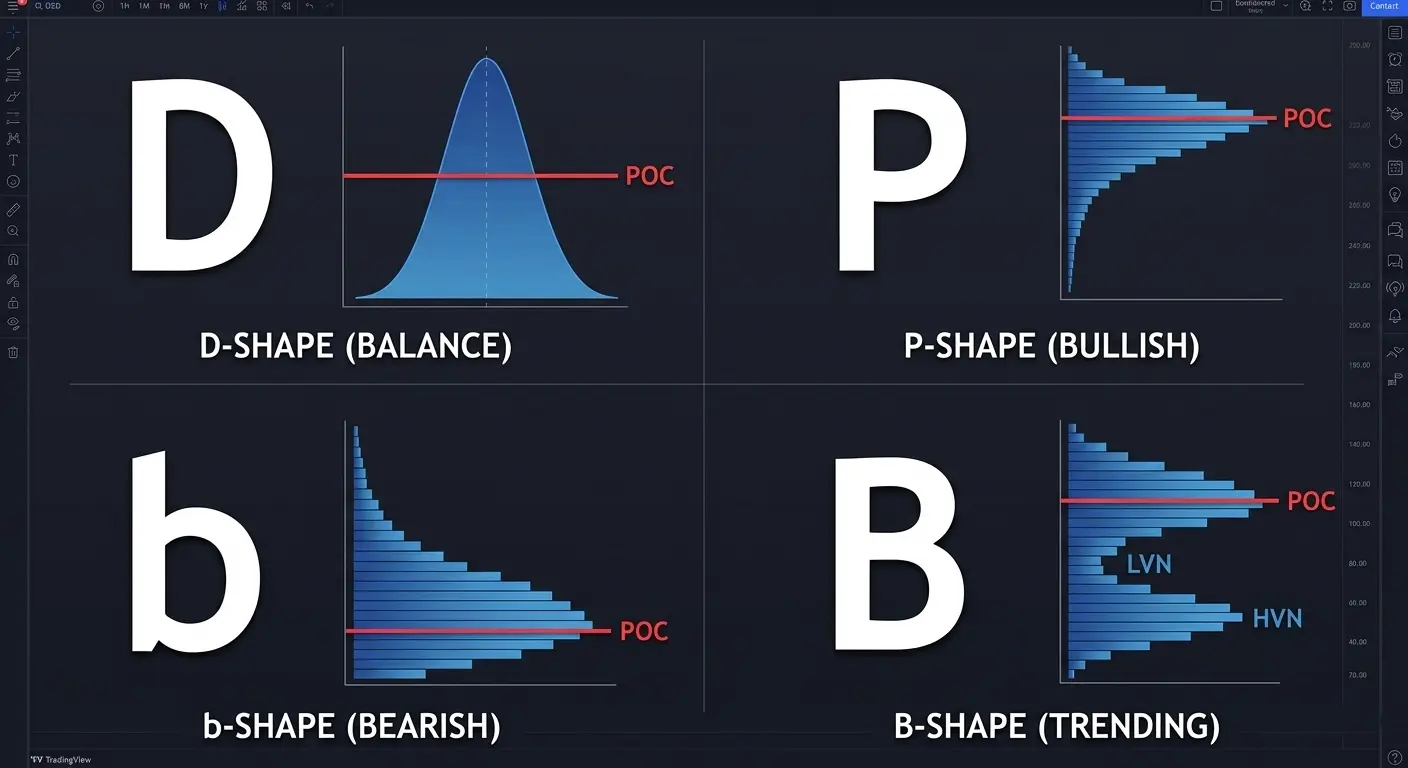
- Read the Profile Shape.
- P-shape: Price rally followed by topping out. Signal of bullish strength/absorption.
- b-shape: Price dump followed by bottoming out. Signal of market weakness.
- D-shape: Balanced market. The crowd is waiting for news or a catalyst.
- Mind the Profile Gap. If there’s an empty spot (LVN) between two trading sessions, price will eventually return to "fill" that void.
Now, let's level up from the basics to the advanced mechanics used by prop traders and institutional whales to read market "sentiment."
7. Composite Profile — The "Big Game" View
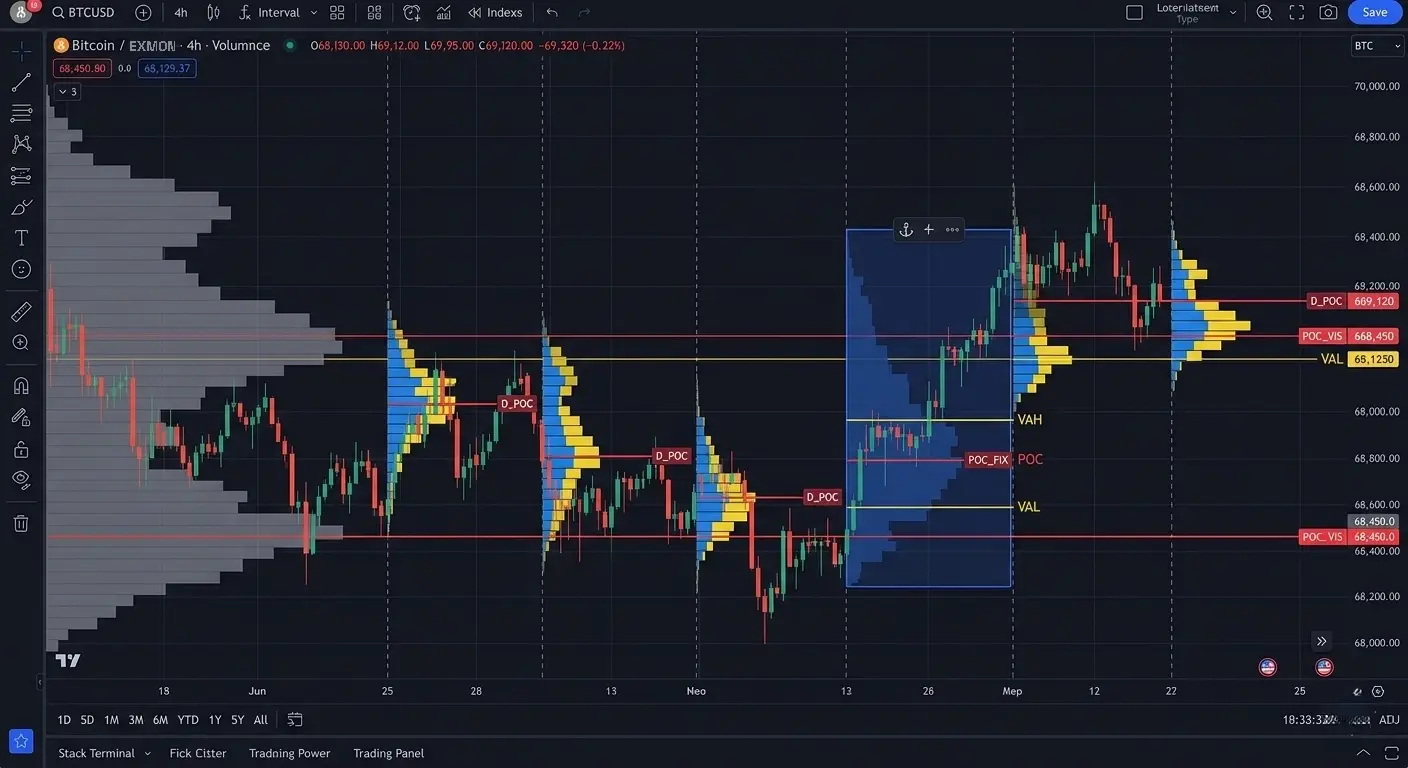
While a session profile shows the intraday tactics, a Composite Profile (merged over weeks or months) reveals the high-timeframe strategic levels.
Why it matters:
When the market is chopping in a wide range for weeks, you'll see multiple POCs popping up. However, only one level acts as the "Core" of the entire accumulation.
- Price above the Composite POC? The bias is bullish (long priority).
- Price below it? The bias is bearish (short priority).
Pro Tip: "POC Migration"
Watch how the POC shifts over time. If the POC closes higher every day even while price is just flat-lining, that’s hidden bullish accumulation. A big player is absorbing the floating supply without letting the price moon too early.
8. Initiative vs. Responsive: How to Read Breakouts
Volume Profile helps you distinguish a fakeout from a true trend starter through the concept of "Price Acceptance."
- Initiative Move: Price blasts out of the Value Area (VA) on high volume and forms a new POC above the previous zone. This means the market has "accepted" the new price as fair. High conviction signal for trend continuation.
- Responsive Move (Fakeout): Price pokes outside the VA, but volume there is thin (LVN). The POC stays stuck in the old zone. 80% of the time, this leads to a mean reversion back into the profile "body."
9. Cheat Sheet: Profile Shape Patterns
The shape of the daily histogram tells the story of the battle between bulls and bears without the lag of oscillators.
| Profile Shape | Visual Image | What’s Actually Happening | Trader’s Playbook |
|---|---|---|---|
| D-shape | Symmetrical Bell | Market is in balance. Whales are sidelined or quietly building clips. | Mean reversion. Trade from VA edges back to POC. |
| P-shape | Thin bottom, fat top | Short squeeze or aggressive impulse up followed by profit taking. | Look for longs on the retest of the POC (the "fat" top). |
| b-shape | Fat bottom, thin top | Long liquidation or aggressive dump followed by consolidation. | Look for shorts on the bounce to the POC. |
| B-shape | Two distinct "humps" (HVNs) | A trend with a mid-way pitstop. Double distribution day. | Play the POC of the specific "hump" where price is currently rotating. |
10. Volume Gaps (The "Vacuum" Method)
This is one of the highest RR (risk-reward) mechanics for crypto and futures scalpers.
When you see a vertical pump or a flash crash, the profile leaves behind an LVN (Low Volume Node). These are gaps where no real trading happened, meaning there's zero support/resistance there.
How it works:
The market hates a vacuum. If price enters an LVN zone, it usually slices through it rapidly until it hits the next major HVN.
Alpha: Use LVNs as "take profit" corridors. Don't set targets inside the "void"; aim for the next high-volume node where the orders actually sit.
11. Merging with Delta (Footprint)
For sniper precision, combine Volume Profile (where the volume was) with Delta (who won—aggressive buyers or sellers).
- POC + Positive Delta: Buyers are defending the level.
- POC + Negative Delta: Aggressive sellers are dominating the node.
If price drops into a major POC and you see Delta spiking green (market buys) while price holds still, that's a "Passive Buyer" (limit orders) absorbing the sell-off. Expect a reversal.
12. Python Snippet for POC Analysis (Pandas)
If you're pulling data via API from Binance or Bybit, you can calculate the POC programmatically.
import pandas as pd
def calculate_poc(df, bins=50):
    # Create price buckets (binning)
    price_bins = pd.cut(df['close'], bins=bins)
    # Group volume by bins
    volume_profile = df.groupby(price_bins)['volume'].sum()
    # Find the bin with the max volume
    poc_bin = volume_profile.idxmax()
    return poc_bin
# Usage:
# df is your DataFrame with 'close' and 'volume' columns
# print(f"Point of Control is within range: {calculate_poc(df)}")
13. The Psychology: Why Does This Work?
Retail S/R levels based on "wicks" are easily hunted by market makers (Stop Hunters). Volume Profile, however, tracks the Real Money.
It’s nearly impossible for an institution to hide their clip when they’re filling thousands of lots. Their footprint stays visible as a POC or HVN. When price returns to these levels, they must either defend their entry or bail out—both of which create the volatility we trade.
Time to dive into the fine-tuning and systematic approach that separates the pro traders from the retail herd.
14. The "Unfair Price" Concept and Spotting Reversals
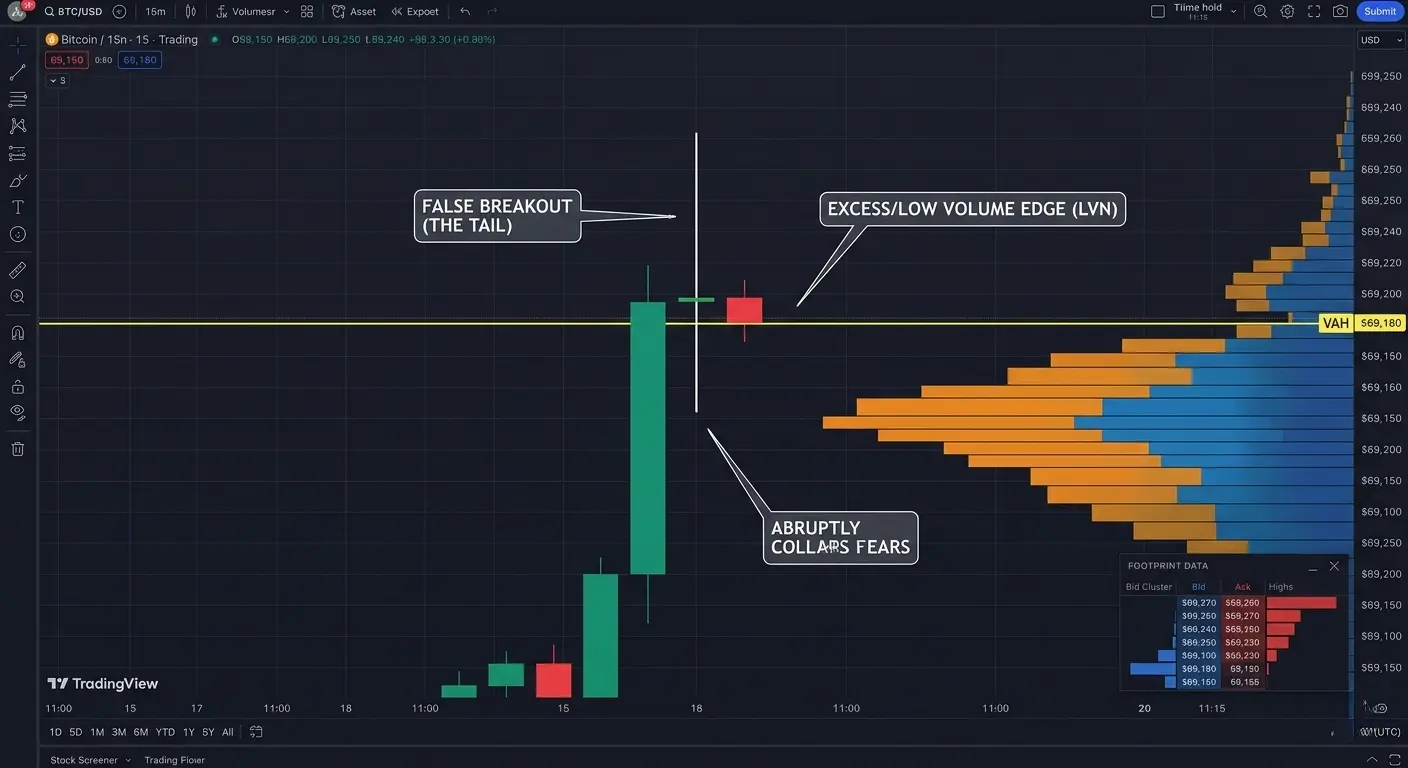
Pros are always hunting for Excess. These are sharp "wicks" or "tails" on the chart with ghost-town volume (LVN) at the very edges of the profile.
- Why it’s a big deal: If the price rockets outside the Value Area but doesn’t find volume support (the profile looks empty there), it means the market hit a massive "limit player."
- Alpha Tip: Look for these tails at VAH or VAL. If the price pokes through a level and immediately snaps back into the Value Area, leaving a hollow histogram behind—that's a textbook fakeout. The market rejected that price as "unfairly high/low."
15. The "POC Relay" Technique (Point of Control Migration)
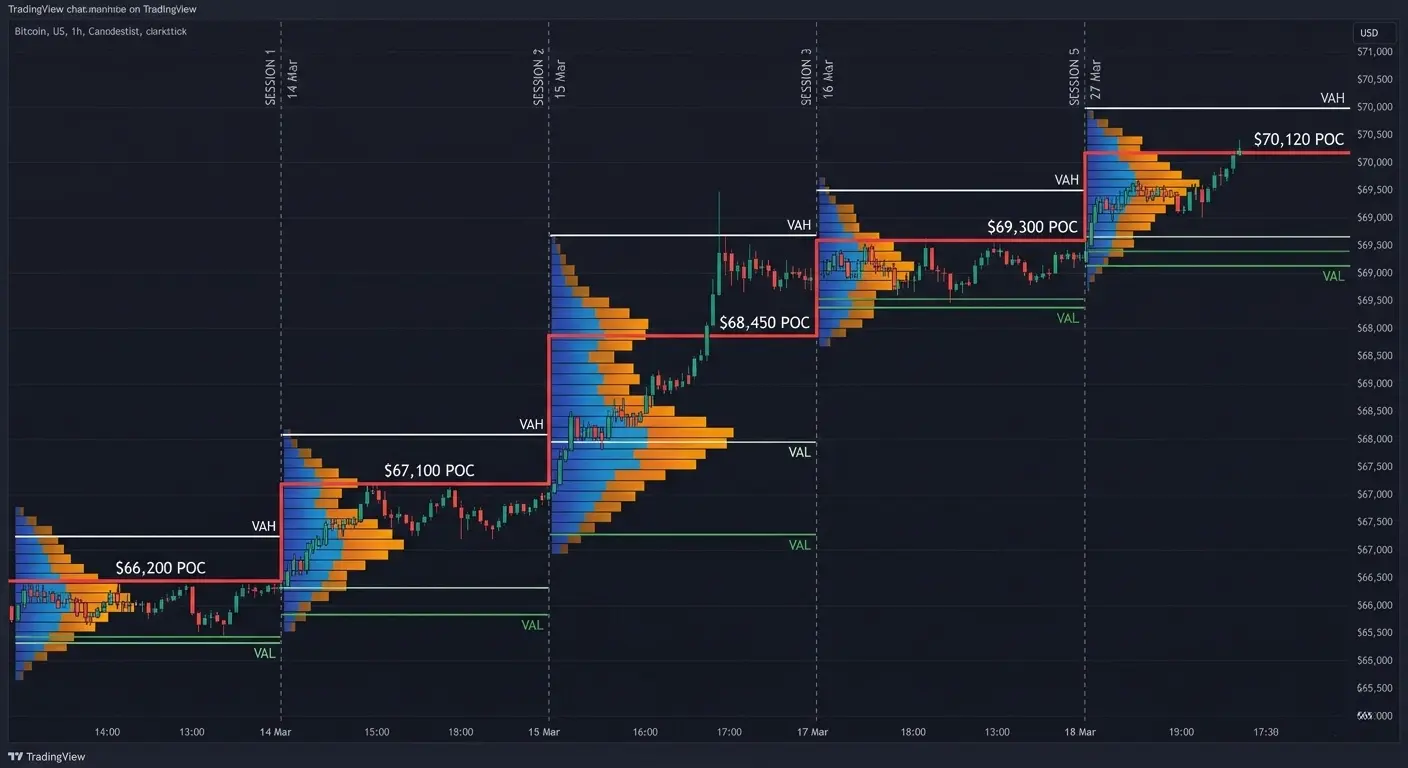
This is how you track a trend without cluttered oscillators. The goal is to pin the POC of every closed trading session (daily).
| Market Context | POC Dynamics | Signal |
|---|---|---|
| Steady Bull Run | Each new POC is higher than the last. | Hold longs; add on dips to the POC. |
| Steady Bear Trend | Each new POC is lower than the last. | Hold shorts; add on bounces to the POC. |
| Trend Exhaustion | Daily POC forms inside the previous day's VA. | Sign of a "chop" or flat market phase. |
| Reversal | After a series of higher POCs, a sharp dump occurs with a POC below the VA. | Switch bias to sell-side. |
16. How to Custom-Fit the Tool
Don't be the trader who leaves everything on "default." To get an edge, tweak these parameters:
- Row Size (Ticks): Set this too low (e.g., 10) and the profile looks "jagged." Set it too high (e.g., 500) and it’s a smooth blob. Aim for a sweet spot where you can clearly see the "humps" (HVNs) and "valleys" (LVNs).
- Value Area Degree: The standard is 70%. This is your "first standard deviation." Only mess with this for specific strats (like 68% to match a perfect Gaussian bell curve).
- Up/Down Volume Split: Turn on buy/sell visualization within the profile. This lets you see who was "bullying" the POC—aggressive market buyers or limit sellers.
17. The Volume Profile Pre-Flight Checklist
Before you hit "Buy" or "Sell," run through these points:
- [ ] Where is the price relative to the Monthly/Weekly POC? (Context)
- [ ] Has price broken out of the VA or is it testing the edge?
- [ ] Is there an HVN (volume support) in the entry zone?
- [ ] What’s the profile shape for the last 3-5 days? (P, b, or D)
- [ ] Is there an LVN "void" above/below that could lead to a fast slip against you?
18. The Summary: Insider Alpha
The biggest secret of the Volume Profile? It’s not a crystal ball—it’s a diagnostic tool. It doesn't tell you where the price will go, but it shows you exactly where the "material resistance" is.
Trading at the POC is trading in the zone of maximum competition. The easiest "fast money" is usually made in Low Volume Nodes (LVN), where the price teleports from one HVN to the next. Pros use the POC as an anchor, but they make their bread on the movement between liquidity nodes.
Reality Check: Remember the "Time Rule." The longer price sits at one level (building a high POC), the more violent the move will be when that balance finally snaps. High volume is a coiled spring.