In the trading world of 2026, where LLM-based algorithms and high-frequency arbitrage desks dominate the landscape, most classic indicators (RSI, MACD, moving averages) have finally turned into pure “noise.” Why? Because they only take price and time into account while completely ignoring liquidity.
The only constant that still holds true is VWAP (Volume Weighted Average Price). This is not just another line on a chart — it represents the “fair value” level that institutional players actually benchmark against.
Part 1: Why VWAP Is the “Foundation” in 2026
Unlike a regular moving average (SMA), where every candle carries the same weight, VWAP factors in how many contracts were traded at each price level.
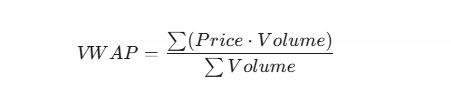
The formula looks like this:
Why this matters today:
- Institutional benchmark: Large funds (BlackRock, Vanguard) execute their orders so that the average entry price is no worse than VWAP. If price is below VWAP, they accumulate; if it is above, they either take profits or wait.
- Protection against manipulation: Low-volume “squeezes” cannot meaningfully shift the VWAP line, while most traditional indicators start throwing false signals.
- Equilibrium point: VWAP marks the level where buyers and sellers are in agreement. A deviation from it signals either an anomaly or the beginning of a new trend.
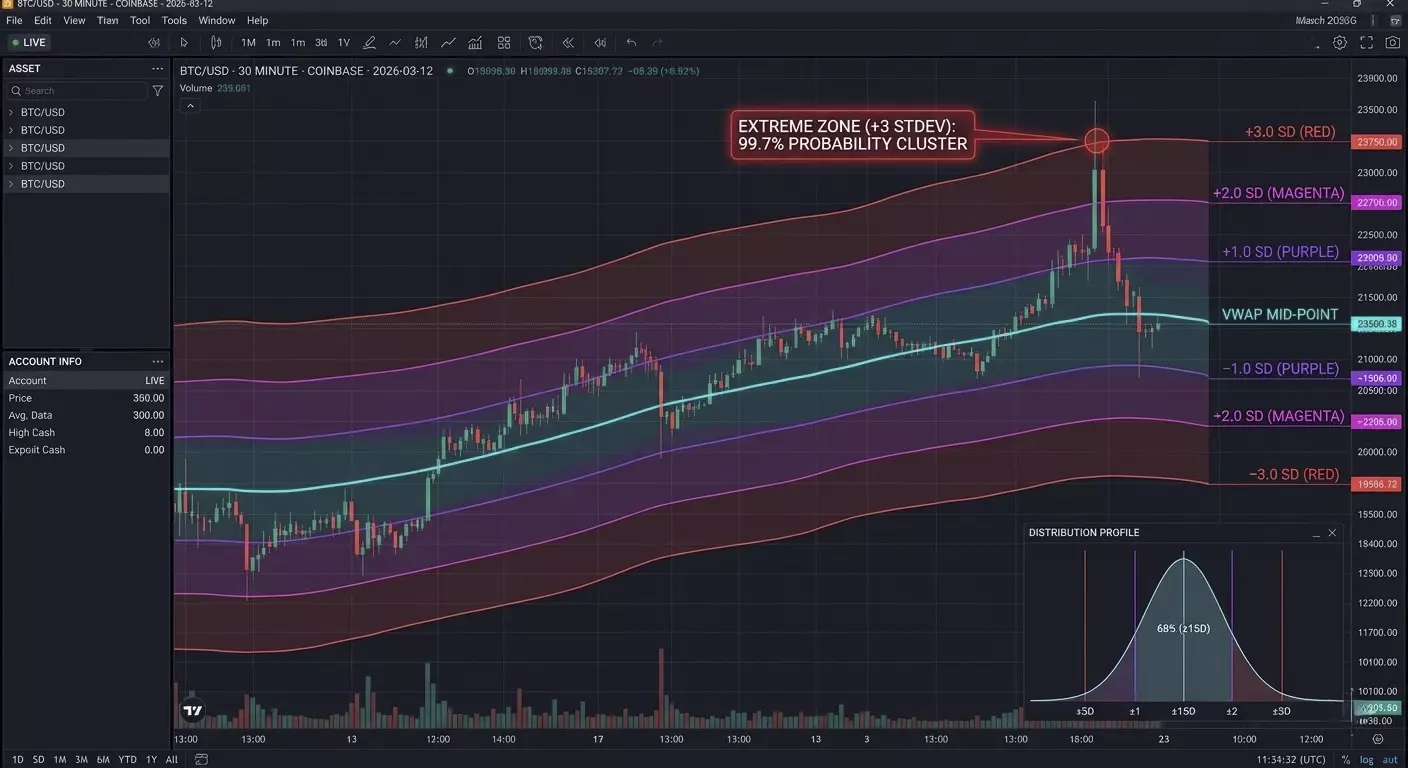
Part 2: The Magic of Standard Deviations
VWAP alone is only half the picture. The real trading action begins at the Standard Deviation Bands (STDEV). In 2026, we treat the market through the lens of “price distribution,” where VWAP acts as the median.
Understanding the zones:
- VWAP ± 1 STDEV: Roughly 68% of all trading happens here. This is the “value area.” If price is inside it, the market is balanced.
- VWAP ± 2 STDEV: The 95% probability boundary. Moves beyond this level are considered extreme.
- VWAP ± 3 STDEV: The “black swan” zone (99.7%). In 2026, these are some of the best spots for counter-trend trades (Mean Reversion).
A little-known fact: Modern HFT algorithms often use a dynamic deviation coefficient tied to current volatility (VIX or IV) instead of fixed values like 1, 2, or 3.
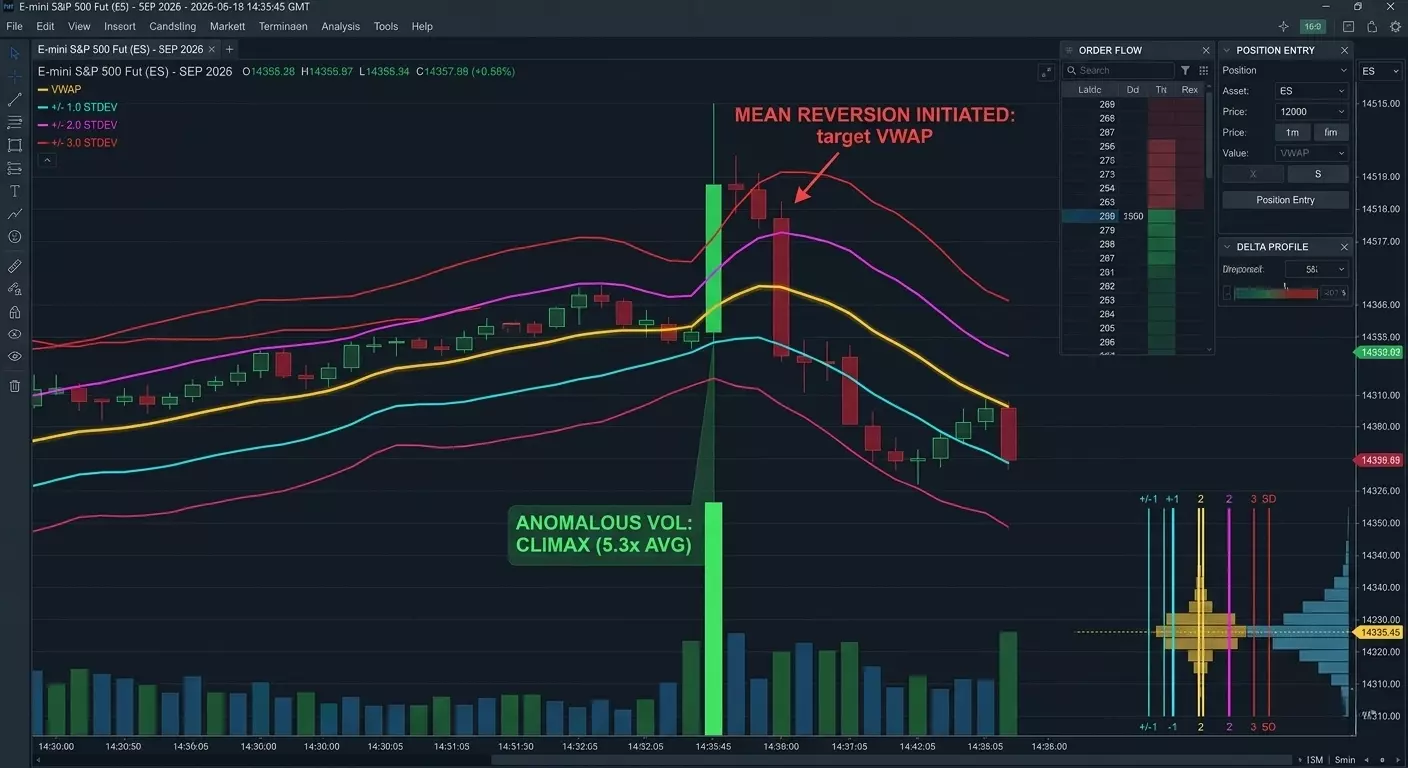
Part 3: The Practical “Mean Reversion 2026” Strategy
The most profitable pattern right now is a false breakout of the second deviation followed by a move back toward the mean.
Step-by-step approach:
- Context: Price moves aggressively away from VWAP on news or right after the session opens.
- Trigger: Price touches or briefly pierces the upper +2 STDEV band.
- Confirmation: On the volume histogram we see a “climax” (a huge vertical bar), but price stops rising. This usually means a large player is dumping into eager longs and closing their position.
- Entry: Go short once price moves back below the +2 STDEV line.
- Targets: Take-profit #1 at VWAP itself. Take-profit #2 at the opposite boundary, −1 STDEV.
Part 4: Code for Automation (Pine Script V5)
If you are using TradingView, the built-in indicator is often overloaded. Here is a clean and minimal script focused purely on VWAP and its deviations:
//@version=5
indicator("VWAP Professional 2026", overlay=true)
// VWAP calculation
var float vwap_sum_pv = 0.0
var float vwap_sum_vol = 0.0
if ta.change(time("D")) // Reset at the start of each new day
    vwap_sum_pv := 0.0
    vwap_sum_vol := 0.0
vwap_sum_pv += (high + low + close) / 3 * volume
vwap_sum_vol += volume
current_vwap = vwap_sum_pv / vwap_sum_vol
// Standard deviation
dev = ta.stdev(close, 100) // Adaptive window based on volatility
plot(current_vwap, color=color.gold, linewidth=2, title="VWAP Core")
plot(current_vwap + dev * 2, color=color.red, title="Upper 2SD")
plot(current_vwap - dev * 2, color=color.green, title="Lower 2SD")
Part 5: The Secret of Anchored VWAP
In 2026, professionals do not just watch the daily VWAP. They actively use Anchored VWAP (AVWAP).
This allows the calculation to be “anchored” not to the start of the day, but to a specific event:
- The moment an important inflation report (CPI) is released.
- A significant local high or low.
- The moment an asset gets listed.
Why this works: Markets have memory. When price approaches a VWAP level anchored to the yearly low, a reaction is almost inevitable, because the average entry price of everyone who bought since the start of the year sits right there.
Part 6: Delta Neutrality and VWAP in 2026
In 2026, professional trading is inseparable from Order Flow analysis. Here, VWAP acts as a filter of "true intent."
Little-known nuance: Delta vs VWAP divergence.
If the asset price is above VWAP, but the cumulative delta (the difference between market buys and sells) starts to drop sharply — this signals hidden selling (Passive Selling). Large players’ limit orders hold the price, "feeding" the asset to market buyers.
Practical tip: Never buy on a break above the +2 STDEV band if delta doesn’t confirm the move. In 90% of cases, this is a "liquidity trap" designed to close large longs at your stop-loss.
Part 7: VWAP Timing (Session Cycles)
The 2026 market moves according to clear time cycles. VWAP behaves differently depending on the trading session phase:
- Accumulation Phase (Pre-market/London): VWAP is often flat. Deviations are minimal. This is the time to set up "grids" of limit orders at the edges of the 1st deviation.
- Distribution Phase (US Open): This is where momentum is born. If in the first 30 minutes of the US session the price stays above VWAP and tests it from above, it’s a "Strong Bullish" signal.
- Exhaustion Phase (Post-settlement): After 22:00 Moscow/Kyiv time, volatility drops. Price tends to return to VWAP ("magnet effect"). This is the best time for mean-reversion strategies.
Part 8: Mathematical Anomaly — "VWAP Pinch"
This is an advanced signal rarely covered in textbooks.
When Standard Deviation Bands start narrowing and almost press against the VWAP line, it signals extremely low volatility.
In 2026, this often precedes a "Liquidity Explosion."
How to trade it: Do not enter a trade inside the pinch. Wait for an impulsive breakout and a close beyond the 1st deviation. The first retest of this boundary is your entry point, with a tight stop behind the VWAP.
Part 9: Python Code Example (Pandas/CCXT)
If you’re building a trading bot or doing backtesting, calculating VWAP on the fly looks like this. This method accounts for the indicator’s cumulative nature throughout the day:
import pandas as pd
def calculate_vwap(df):
    # df must contain 'high', 'low', 'close', 'volume' columns
    typical_price = (df['high'] + df['low'] + df['close']) / 3

    # Cumulative sum of (Price * Volume) and Volume
    pv = typical_price * df['volume']
    cum_pv = pv.cumsum()
    cum_vol = df['volume'].cumsum()

    vwap = cum_pv / cum_vol

    # Standard deviation calculation (simplified)
    std_dev = df['close'].expanding().std()

    return vwap, vwap + (std_dev * 2), vwap - (std_dev * 2)
# Example usage:
# df['vwap'], df['upper'], df['lower'] = calculate_vwap(df)
Part 10: Why Other Indicators Fail
- RSI: In a strong trend, it can stay in the overbought zone for weeks. VWAP, however, follows the price, always showing the actual risk zone.
- Bollinger Bands: Based on a simple moving average (SMA). They don’t "see" where the main capital is entering; they only show the mathematical average of prices over the period.
- Fibonacci: These are psychological levels. VWAP represents real money levels. In 2026, algorithms don’t care about the "golden ratio"; they look at their own break-even points.
Summary for Practitioners
VWAP is the only indicator that can’t be "faked" because it is directly tied to trading volume. In 2026, your trading system should revolve around three questions:
- Where is the price relative to VWAP? (Trend)
- At which deviation are we? (Risk/Reward)
- What is Delta doing at this moment? (Confirmation)
Master these three components, and you’ll trade on the side of the "smart money," not against it.
Frequently Asked Questions
Why is VWAP more reliable than a standard Moving Average in 2026?
Unlike a Simple Moving Average (SMA), which only considers price over time, VWAP incorporates trading volume. In a market dominated by algorithms, VWAP reveals where the "smart money" is actually positioned. An SMA treats a low-volume price spike the same as a high-volume institutional move, whereas VWAP remains anchored to the true value where the most liquidity was exchanged.
What is the most effective Standard Deviation level for Mean Reversion?
In 2026, the ±2.0 Standard Deviation (STDEV) is considered the primary threshold for mean reversion setups. Statistically, 95% of price action occurs within this band. When price touches the 2nd deviation accompanied by a volume climax, it signals an exhaustion point with a high probability of returning to the central VWAP line.
Can VWAP be used for long-term swing trading?
Yes, by using the Anchored VWAP (AVWAP). Instead of resetting daily, you can anchor the indicator to a significant event, such as a Yearly High/Low, a major CPI data release, or a corporate earnings report. This allows you to see the average entry price of all market participants since that specific event, creating powerful long-term support and resistance levels.