For Bitcoin (BTC), footprint analysis is a critical necessity as the market is saturated with algorithms, "spoofing" (fake limit orders), and liquidations. Due to the high concentration of professional market participants, BTC footprint data often prints "cleaner" than many pairs. However, if you are new to these concepts, we recommend starting with our foundational guide to reading order flow and footprint charts to better understand the mechanics of market auctions."
Here are the specific settings and footprint analysis tactics tailored for Bitcoin in 2026.
1. Volume Filter Settings (Clustering)
Bitcoin is highly volatile, so "noisy" retail trades (0.001 BTC) are merely a distraction. To track "Smart Money," you must filter the clusters.
Recommended parameters (for 5-min or 1000-Tick charts):
- Single Print Filter: Hide trades smaller than 5-10 BTC. This helps isolate zones where institutions or high-net-worth traders are entering.
- Bold Highlighting: Mark levels where volume exceeds 50-100 BTC per single price tick. These are your future support/resistance levels.
- Imbalance: Set the ratio to 350% (Ratio 3.5). For BTC, this is the "gold standard" for filtering out random market imbalances.
2. BTC-Specific Setup: "Liquidation Cascade"
Bitcoin thrives on liquidations, and the footprint is the only way to witness them in real-time.
What it looks like: The price drops sharply, and the footprint shows massive red clusters (heavy selling at the Bid), while cumulative delta plunges vertically.
The Trap: Often, this isn't "smart selling" but rather forced long liquidations.
Buy Signal: If, following such a cascade of red clusters, you see even a single candle with positive delta and the POC (Point of Control) located in the lower wick, it’s a classic "Liquidation Reversal." A major player has absorbed the panic.
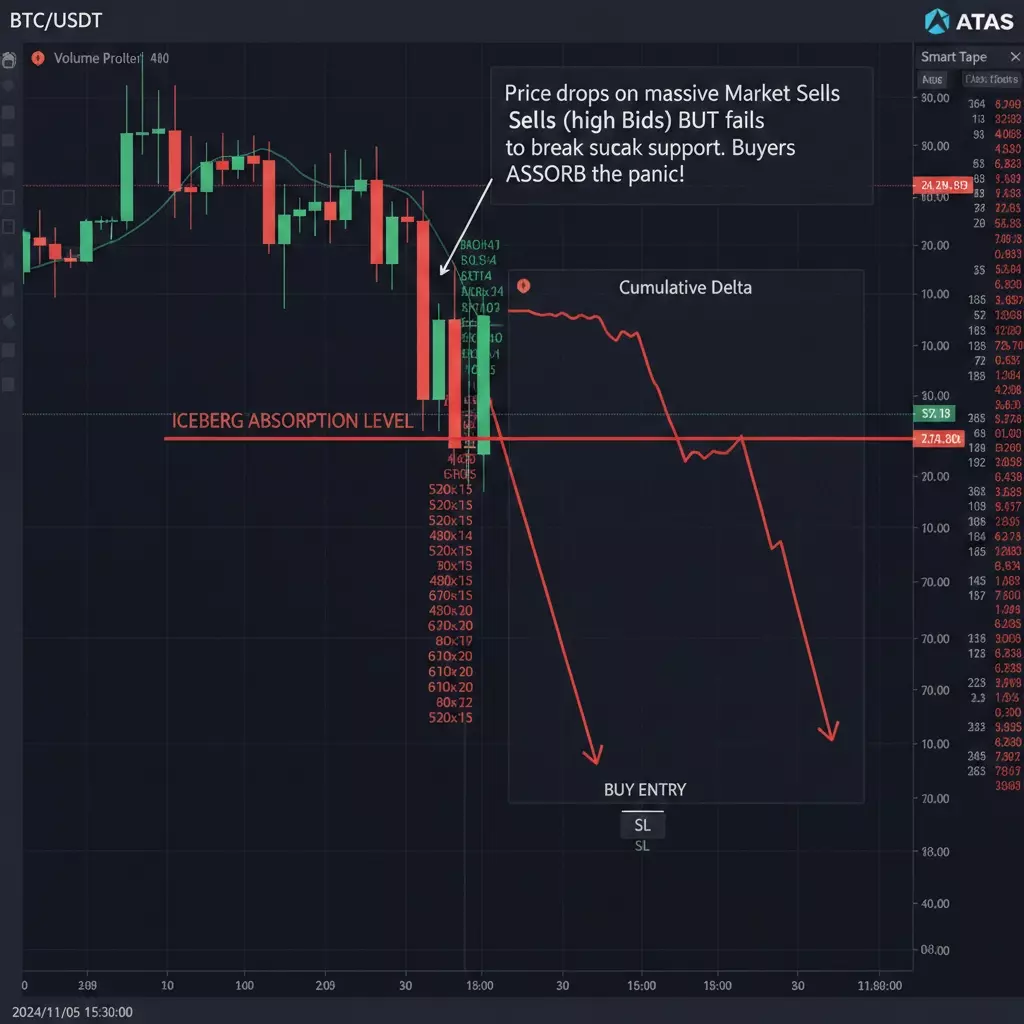
Figure 1: Real-time visualization of a BTC liquidation cascade. Notice how massive market sell orders are absorbed by a limit buy wall (Iceberg), leading to an immediate price reversal.
3. BTC POC Migration (Volume Migration)
Monitor how the POC (Point of Control) moves within candles during a trend.
| POC Movement | Interpretation for BTC |
|---|---|
| Step-like Ascent | Healthy trend. Buyers are aggressively defending every new level. |
| POC in the (Upper) Wick | Sign of exhaustion. Bulls are hitting a Limit Barrier (Sell Wall). |
| POC Gapping over a Level | "Gapping." A sign of extreme momentum, often leading to trend acceleration. |
4. Code Example: Detecting Anomalous Clusters (Python/Binance)
If you are using an API to monitor anomalies, this logic fragment helps catch "walls" that have started to execute:
# Detecting an "Iceberg" or a large Limit Player on BTC
def detect_btc_absorption(df_cluster, threshold_vol=100):
    """
    df_cluster: DataFrame with columns 'price', 'bid_vol', 'ask_vol', 'delta'
    threshold_vol: BTC threshold per single price level
    """
    # Look for levels with massive volume but skewed delta
    heavy_levels = df_cluster[df_cluster['total_vol'] > threshold_vol]
    for index, row in heavy_levels.iterrows():
        # If Bids (market sells) are 5x larger than Asks, yet price stays firm
        if row['bid_vol'] > row['ask_vol'] * 5:
            print(f"Sell absorption detected at price {row['price']}: {row['bid_vol']} BTC")
            # This indicates a potential 'Buy Wall' (Absorption/Iceberg)
5. Practical Advice on BTC Platforms
In crypto, data varies significantly between exchanges.
- If trading futures, prioritize footprint data from Binance Futures or Bybit.
- Pro-tip: Aggregate your data. Certain terminals (like TRDR or Velo.xyz) allow you to merge the footprint from the top 5-10 exchanges into a single chart. This provides the most accurate picture of market delta.
Checklist: Entering a BTC Trade (Setup: Absorption)
Step 1: Context (Where are we?)
- [ ] Price has reached a significant level (Yesterday's High/Low, Weekly POC, or major resistance).
- [ ] Important: We NEVER trade the footprint in the middle of a vacuum (empty range).
Step 2: Footprint Observation (What do we see?)
- [ ] Aggression: Price tries to break the level, and delta turns extreme (bright green for upside breakout / bright red for downside).
- [ ] Imbalance: Diagonal imbalances > 350% appear in the clusters (Buyer/Seller Imbalance).
- [ ] Sign of Absorption: Despite massive market buying (Ask), the price "stalls" and fails to move more than 5-10 ticks higher.
Step 3: Culmination (Point of No Return)
- [ ] POC in the Wick: The candle's maximum volume (POC) has shifted to the upper (for Longs) or lower (for Shorts) shadow.
- [ ] Finished Auction: At the absolute extreme (tip of the wick), the opposite side value is 0 (e.g., in a rally, Ask becomes 0 at the very top).
- [ ] Delta Reversal: The delta of the current candle starts shrinking rapidly even though volume remains high.
Step 4: Entry Signal (Action!)
- [ ] Trigger: The candle closes, leaving "trapped volume" in the wick.
- [ ] Entry: Market order in the direction of the reversal (Short if buyers are trapped at the top).
- [ ] Stop-Loss: Strictly above the cluster with the maximum volume (POC) of that candle + 2-3 ticks of breathing room.
- [ ] Take-Profit: Nearest High Volume Node (HVN) or the opposite boundary of the current range.
Example Parameters for BTC (TradingView / ATAS / Tiger)
| Parameter | Value for BTC | Purpose |
|---|---|---|
| Cluster Size | 50.0 - 100.0 (Step) | Filters out micro-movements to avoid clutter. |
| Volume Filter | > 20 BTC per cluster | Highlights blocks of institutional capital. |
| Imbalance Ratio | 3.5 (350%) | Filters out standard market noise. |
| Stacked Imbalances | 3 consecutive levels | Signals a "wall" or a powerful momentum impulse. |
The Golden Rule of Discipline
If you see a massive delta (e.g., +500 BTC) but the price closes below that volume—never buy. This is a "tombstone" of market buyers who are now trapped underwater.