Using Fibonacci numbers in trading isn’t magic — it’s a mathematical reflection of crowd psychology and natural cycles. In this article, we’ll break down how to turn a simple “grid” into a powerful tool for predicting support and resistance levels.
1. Chaos Math: Why does it work?
At the core are the Fibonacci sequence numbers, where each number is the sum of the two previous ones (1, 1, 2, 3, 5, 8, 13, 21 …). The key for traders is the Golden Ratio ( 1.618) and its inverse (0.618).
In the market, these levels act like a self-fulfilling prophecy: millions of algorithms and traders watch the same levels, turning a mathematical abstraction into a real wall of orders.
2. Core Tools
For this, we’ll need two key tools:
- Fibonacci Retracement: Used to find entry points within a trend.
- Fibonacci Extension: Used to define targets (Take Profit) beyond the previous price range.
Key levels you should have in your terminal:
- 0.236 (23.6%): A shallow pullback, a sign of a very strong trend.
- 0.382 (38.2%): The first meaningful barrier.
- 0.500 (50.0%): Not a Fibonacci number, but a critical psychological level (Dow Theory).
- 0.618 (61.8%): The Golden Pocket. The most important level.
- 0.786 (78.6%): The last line before a full trend invalidation.
3. Practice: How to draw levels correctly
The most common mistake beginners make is choosing the wrong points X and Y.
The “Left to Right” rule
The tool is always drawn in the direction of time:
- In an uptrend: Draw from the low (Swing Low) to the high (Swing High).
- In a downtrend: Draw from the high (Swing High) to the low (Swing Low).
The wick (shadow) debate
Pros argue: should you draw using candle bodies or wicks?
Tip: In volatile assets (crypto), it’s better to use wicks since they capture extreme liquidity. In calmer markets (Forex, blue chips), levels based on candle bodies often work cleaner.
4. Advanced Techniques: Confluence
Never trade “naked” Fibonacci. A level’s strength increases exponentially if it aligns with other factors:
- Fib + Horizontal Level: If the 0.618 level aligns with a historical flip level (former resistance turned support), that’s a “rock-solid” entry point.
- Fib + Moving Average (MA): For example, the 0.5 level lining up with the 200 EMA.
- Fib + POC (Point of Control): When a level совпадает with the highest traded volume on the volume profile.
5. The lesser-known “Golden Pocket”
Most people know about 0.618. However, professional traders focus on the zone between 0.618 and 0.65. This is the Golden Pocket. Often, price makes a fake breakout of 0.618, sweeps stops, and reverses within that tight range up to 0.65.
6. Automation: Pine Script example (TradingView)
If you want to see levels automatically, you can throw together a simple script. This code finds local extremes over the last 50 bars and draws the grid.
Pine Script
//@version=5
indicator("Auto Fib Levels by Gemini", overlay=true)
lookback = input.int(50, "Lookback Period")
high_ = ta.highest(high, lookback)
low_ = ta.lowest(low, lookback)
// Level calculation
f236 = high_ - (high_ - low_) * 0.236
f382 = high_ - (high_ - low_) * 0.382
f500 = high_ - (high_ - low_) * 0.500
f618 = high_ - (high_ - low_) * 0.618
// Visualization
plot(high_, color=color.red, title="High")
plot(f236, color=color.gray, title="0.236")
plot(f382, color=color.orange, title="0.382")
plot(f500, color=color.yellow, title="0.500")
plot(f618, color=color.green, linewidth=2, title="0.618")
plot(low_, color=color.red, title="Low")
7. Psychological traps and risk management
Fibonacci isn’t a price magnet — it’s a map of interest zones.
- Expectation: Price touches 0.618 and rockets to the moon.
- Reality: Price can slice through the level on news.
Practical tip: Always look for confirmation on a lower timeframe. If price reaches 0.618, wait for a pattern like “Engulfing” or a “Pin Bar” before hitting the BUY button.
Moving on to more advanced concepts that separate a hobbyist from a professional trader.
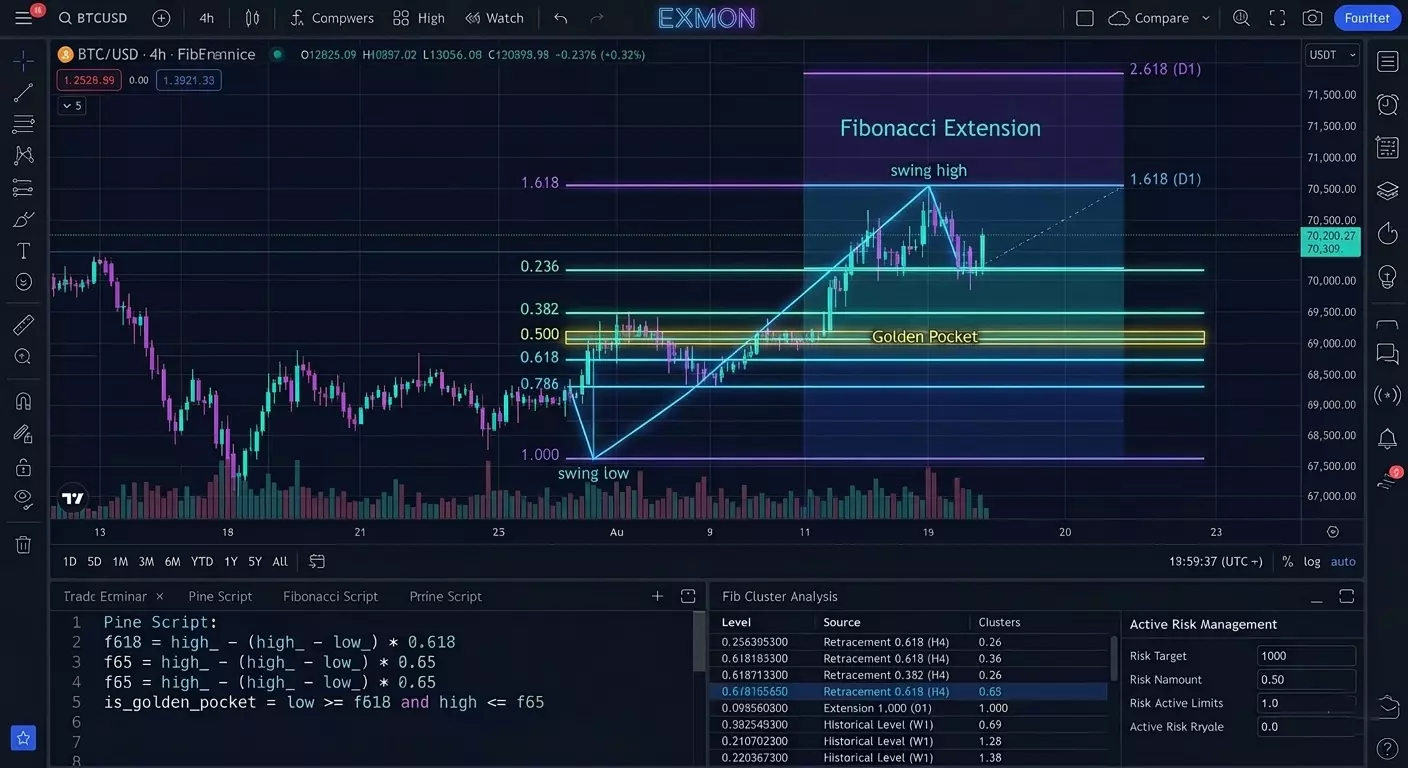
8. Fibonacci Extension — Where to Take Profits?
While a retracement tells us where to enter, the extension shows where to take profits. This is an essential tool when trading at historical highs, where there are no resistance levels ahead.
How to plot the extension:
Unlike a retracement (2 points), an extension requires 3 points:
- Point A: Start of the impulse (Low).
- Point B: Peak of the impulse (High).
- Point C: End of the retracement (Higher Low).
Key take-profit levels:
- 0.618 (61.8%): Conservative target.
- 1.000 (100%): Wave equality (AB = CD). Most common target for classic patterns.
- 1.618 (161.8%): Main target in a strong trend. Often where a major reversal occurs.
- 2.618 (261.8%): Market “overheat” zone.
9. Fibonacci Time Zones
Few traders use this tool, but it’s crucial for understanding timing. Instead of guessing where the price will go, we try to understand when a trend change will happen.
The tool places vertical lines on the chart based on the sequence (1, 2, 3, 5, 8, 13...). Practical tip: drag the time grid between two significant peaks. The vertical lines will highlight zones where volatility or reversals are likely. It doesn’t guarantee a reversal, but it warns: “Be alert around this time.”
10. Combining with Elliott Wave Theory
Fibonacci is the “backbone” of wave analysis. Professionals rely on these relationships:
- Wave 2 usually retraces to 0.5 or 0.618 of Wave 1.
- Wave 3 (the strongest) often reaches 1.618 extension of Wave 1.
- Wave 4 is usually shallow — up to 0.236 or 0.382 of Wave 3.
11. Dynamic Levels: Fibonacci Fan
If regular levels are horizontal, the Fan is diagonal support and resistance levels, taking into account not just price but the slope of the trend (speed of movement).
How to use it: Draw a trendline from the low to the high. The indicator will generate the rays. If the price breaks the top ray and drops below the middle, this often signals a slowdown and a move into sideways action or a reversal.
12. The “Hidden” 0.886 Level
Many standard terminal settings ignore the 0.886 level (fourth root of 0.618).
In harmonic trading (patterns like “Bat” or “Gartley”), this level is considered critical. If the price pierces 0.786 but stops at 0.886, it often signals a deep false breakout before a strong trend continuation.
13. Code Example: Fibonacci Level Scanner in Python
For those involved in algo trading or data analysis, it’s important to find these levels programmatically. Here’s an example of calculating levels for any dataset (e.g., from the yfinance library).
import numpy as np
def get_fibonacci_levels(price_high, price_low):
    diff = price_high - price_low
    levels = {
        "0.0%": price_high,
        "23.6%": price_high - 0.236 * diff,
        "38.2%": price_high - 0.382 * diff,
        "50.0%": price_high - 0.5 * diff,
        "61.8%": price_high - 0.618 * diff,
        "78.6%": price_high - 0.786 * diff,
        "100.0%": price_low
    }
    return levels
# Example usage:
high_point = 150.00
low_point = 100.00
fib_levels = get_fibonacci_levels(high_point, low_point)
for level, price in fib_levels.items():
    print(f"Level {level}: {price:.2f}")
14. Professional Checklist Before a Trade:
- Higher timeframe: Identify the overall trend (D1 or H4). Fibonacci on M5 works much worse.
- Grid: Apply Fibonacci Retracement to the last clear impulse.
- Confluence: Check if the 0.618 level coincides with a round number or a previous support level.
- Candlestick pattern: Wait for confirmation (don’t place a limit order exactly on the line; let the market validate the level).
- Stop-loss: Usually placed beyond the next Fibonacci level (e.g., if entering at 0.618, stop beyond 0.786).
Now we’re getting to the really interesting part — the professional nuances that rarely get covered in free courses, and the systematic strategy of using Fibonacci in real market conditions.
15. Fibonacci Clusters — The Ultimate Method
A cluster is an area on the chart where Fibonacci levels from different price moves overlap. This is the strongest forecasting technique.
How to do it:
- Draw a retracement grid on the main trend (for example, the daily timeframe).
- Draw a second grid on the latest local impulse within that trend.
- Use Fibonacci extension (3 points) to determine targets.
Result: The places where lines from different grids converge the most (forming a tight "corridor") are zones of maximum liquidity. This is where big players take profits or open positions.
16. Fibonacci Levels as a Stop-Loss Filter
Professionals use levels not only for entry but also for mathematically justified exits.
Level 1.272 (Inverse Retracement): This is the square root of 1.618. If the price breaks the 1.0 level (start of the impulse) and reaches 1.272, it’s a classic "false breakout" or "stop hunt" zone. If you see a reversal candle at 1.272, it’s a strong signal that the trend is alive and it was just a shakeout of weak hands.
17. Market-Specific Nuances (Crypto vs Stocks vs Forex)
The math is the same everywhere, but crowd psychology differs:
- Cryptocurrencies: Due to high volatility, levels 0.236 and 0.382 are often ignored. The most reliable range is 0.618–0.786. Bitcoin loves deep corrections.
- Stock Market (Stocks): Level 0.5 (50%) works very well here. Blue-chip stocks are more stable and often follow classic Dow theory.
- Forex: Currency pairs often move in channels. Fibonacci levels work best combined with trading sessions (for example, testing 0.618 at the London open).
18. Advanced Python Algorithm: Determining Level "Strength"
For those who want to automate cluster analysis, you can use a density distribution approach.
Python
import numpy as np

def find_fib_clusters(trends):
    """
    trends: list of tuples (high, low) for different periods
    """
    all_levels = []
    ratios = [0.236, 0.382, 0.5, 0.618, 0.786]

    for high, low in trends:
        diff = high - low
        for r in ratios:
            all_levels.append(high - r * diff)

    # Grouping close levels into clusters (threshold 0.5%)
    all_levels.sort()
    clusters = []
    if not all_levels:
        return clusters

    current_cluster = [all_levels[0]]
    for i in range(1, len(all_levels)):
        if (all_levels[i] - all_levels[i-1]) / all_levels[i-1] < 0.005:
            current_cluster.append(all_levels[i])
        else:
            if len(current_cluster) > 1:  # Strong cluster = 2+ matches
                clusters.append(np.mean(current_cluster))
            current_cluster = [all_levels[i]]
    return clusters

# Example data: (High, Low) global and local
data = [(1000, 500), (800, 600)]
print(f"Strong zones (clusters): {find_fib_clusters(data)}")
19. Key No-No’s When Using Fibonacci
- Don’t draw grids in a sideways market (flat). Fibonacci is a trend tool. In consolidation it will give random levels that price will just chop back and forth.
- Don’t ignore context. If there’s a Fed rate news release, no "golden ratio" will stop a crash. Levels are probability zones, not magical barriers.
- Don’t clutter the chart. If you draw 10 grids, the whole chart will be full of lines. Price will always be "at some level." Leave only the 2–3 most significant impulses.
20. Conclusion: Your Roadmap
To become a Fibonacci master:
- Learn to accurately identify Swing High and Swing Low (use the ZigZag indicator for practice).
- Always look for convergence (Fibo clusters + volume levels + horizontal levels).
- Use extensions to lock in profits — this removes emotion from your trading.
- Remember the Golden Pocket (0.618–0.65) — this is where the cleanest reversals happen.
Fibonacci tools aren’t a holy grail, but they are the best way to organize market chaos and see structure where others just see noise.
Frequently Asked Questions (FAQ)
Why does price often reverse exactly at the 0.618 level?
There are two reasons: mathematical and psychological. The 0.618 level (Golden Ratio) is a natural constant of cycles. In trading, it turns into a self-fulfilling prophecy — since most algorithms and big players place limit orders in this zone, it creates high liquidity density, triggering reversals.
On which timeframe do Fibonacci levels work best?
Fibonacci is a fractal tool; it works on any interval. However, on higher timeframes (H4, D1, W1), levels are considered more reliable because they account for more market data and are less affected by the "market noise" that is common on minute charts.
Should I redraw the grid if price makes a new high?
Yes. If you drew a grid on an impulse but the price didn’t pull back and broke level 0 (the high in an uptrend) and closed above it, the current grid becomes outdated. You need to rebuild it using the new high (Swing High) as the upper point to get updated support levels.