The MACD (Moving Average Convergence Divergence) identifies a trend by showing the relationship between two moving averages of price. When the MACD line crosses above the signal line, it indicates a potential start of an uptrend. When it crosses below, it signals a possible downtrend. The histogram—the bars that oscillate above and below the zero line—shows the momentum and strength of that trend.
That’s the essence: MACD reveals both direction and momentum, giving traders a dynamic way to confirm whether a market is trending and how strong that trend is.
The Core of MACD: What It Really Measures
At its heart, MACD transforms moving averages into a momentum gauge.
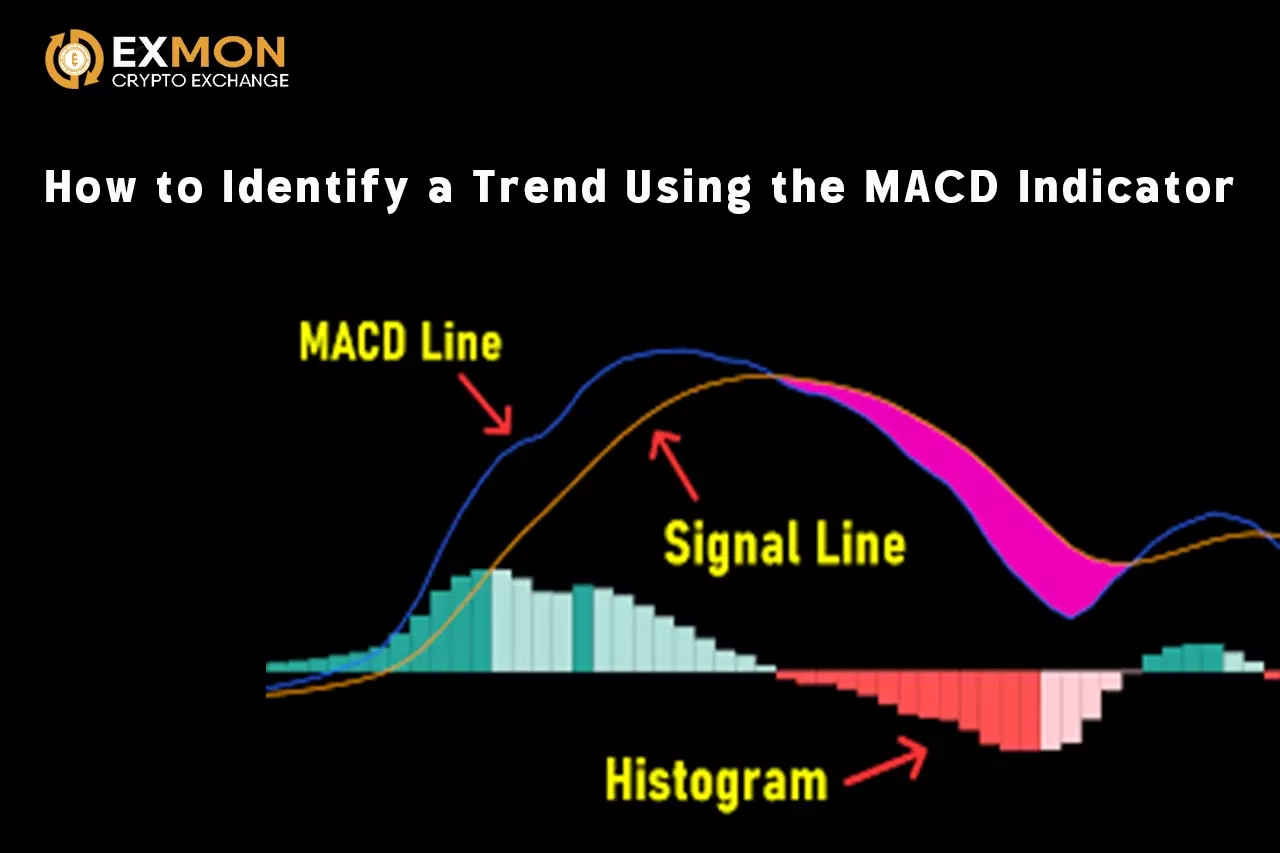
It consists of three components:
- MACD Line = 12-period EMA – 26-period EMA
- Signal Line = 9-period EMA of the MACD Line
- Histogram = MACD Line – Signal Line
Each number represents trading periods (days, hours, or minutes depending on your chart). The default setup—12, 26, and 9—works well across most markets, but the concept is universal.
When the shorter EMA (12) moves away from the longer EMA (26), it means the short-term trend is gaining momentum in that direction. When they converge, momentum weakens.
Reading Trend Direction
1. Uptrend Recognition
When the MACD line is above the signal line and both are above the zero line, the market is in a confirmed uptrend.
- The crossover above the zero line is key—it means the shorter-term average has overtaken the longer-term average on a sustained basis.
- Example: On a daily Bitcoin chart, when the MACD line crossed above zero in mid-October 2023, BTC was trading around $27,000. Within weeks, the price rallied over $30,000. The MACD had identified the transition from neutrality to bullish momentum early.
2. Downtrend Recognition
When the MACD line crosses below the signal line, and both move below zero, it marks a confirmed downtrend.
- The cross below zero shows that short-term momentum is weaker than the longer-term trend—classic bearish pressure.
- Example: In May 2022, when Ethereum’s MACD crossed below zero after a brief recovery, ETH was around $2,700. Within a month, it had dropped under $1,900.
The zero line acts as a filter: crossovers above it favor long trades, crossovers below favor short or defensive positioning.
Understanding Trend Strength Through the Histogram
The histogram is one of the most overlooked yet most powerful parts of MACD. It visually measures the distance between the MACD line and the signal line:
- Expanding histogram bars = increasing momentum → trend strengthening.
- Contracting histogram bars = decreasing momentum → trend weakening.
For example, if you see the MACD line above the signal line but the histogram bars are shrinking, it warns that the uptrend may be losing steam even before a crossover occurs. Traders often use this as an early exit signal.
Spotting Reversals Before They Happen
The MACD is not just for following trends—it can warn of trend exhaustion through divergence.
- Bullish divergence: Price makes a new low, but the MACD forms a higher low → indicates weakening downward momentum and possible reversal upward.
- Bearish divergence: Price makes a new high, but the MACD forms a lower high → shows fading bullish strength and a potential downward reversal.
Example: In August 2021, the NASDAQ Composite showed higher highs on price, but the MACD histogram formed lower peaks. Within two weeks, the market corrected by 6%.
Divergences don’t predict exact reversal points, but they signal instability in the current trend.
Practical Application Strategy
A practical and disciplined way to use MACD for trend identification:
- Identify Zero-Line Bias – If MACD is above zero, look only for buying opportunities. If below, look for selling or shorting.
- Wait for the Crossover – The MACD crossing the signal line confirms the short-term shift.
- Check the Histogram – Expanding bars mean strength; contracting bars mean weakening.
- Confirm with Price Action – MACD alone is not a trigger; always confirm with higher highs/lows (for uptrend) or lower highs/lows (for downtrend).
Example workflow for BTC/USD on a 4-hour chart:
- MACD crosses above zero → Uptrend bias.
- Histogram expands → Entry opportunity.
- MACD crosses below signal line → Possible exit or reversal warning.
Final Thoughts
The MACD is not just an indicator—it’s a visual model of market energy. It tells you not only where the market is moving but also how strongly it’s moving there.
To identify a trend using MACD, focus on three confirmations:
- Crossover of MACD and signal line
- Position relative to the zero line
- Behavior of the histogram
When all three align, the trend is real—and the earlier you recognize that alignment, the more precisely you can position your trades.
Would you like me to make a second version of this article optimized for publication on EXMON Academy (with SEO structure and internal link references)? It would include meta description, subheaders, and a CTA section at the end.